Weekly Technical Analysis (28 Oct to 4 Nov 2026): Gold Tests Support at €3,601.78/oz & Silver Corrects to €46.34/oz with GSR at 77.73
✍️ Analista TroyRadar📅 4 de noviembre de 2026⏱️ 5 min read👁️ 25 lecturas
📑Table of Contents
Arrancamos la semana analizando al milímetro la estructura técnica del Oro (XAU), la Plata (XAG) y el Ratio Oro/Plata (GSR) tanto en Euros (€/oz y €/g) como en Dólares ($/oz), cruzando las visiones de corto plazo (semanal), medio plazo (mensual) y largo plazo (anual) con lo que realmente pagas en el mostrador de las tiendas físicas.
⚡ Semáforo Técnico Semanal (28 oct al 04 nov 2026)
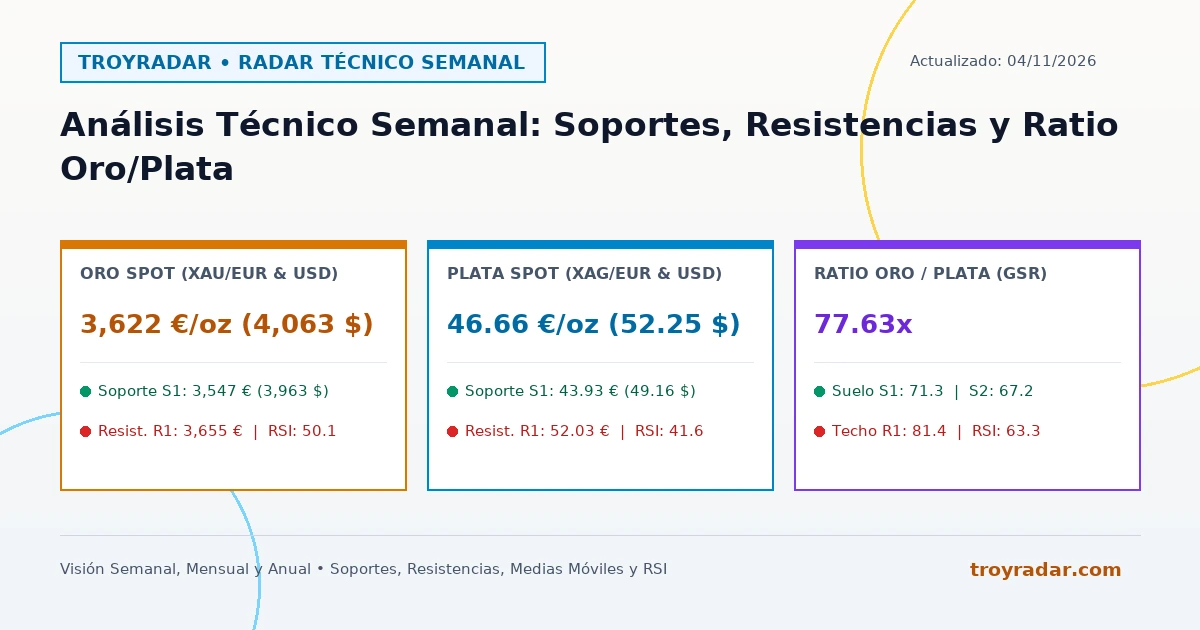
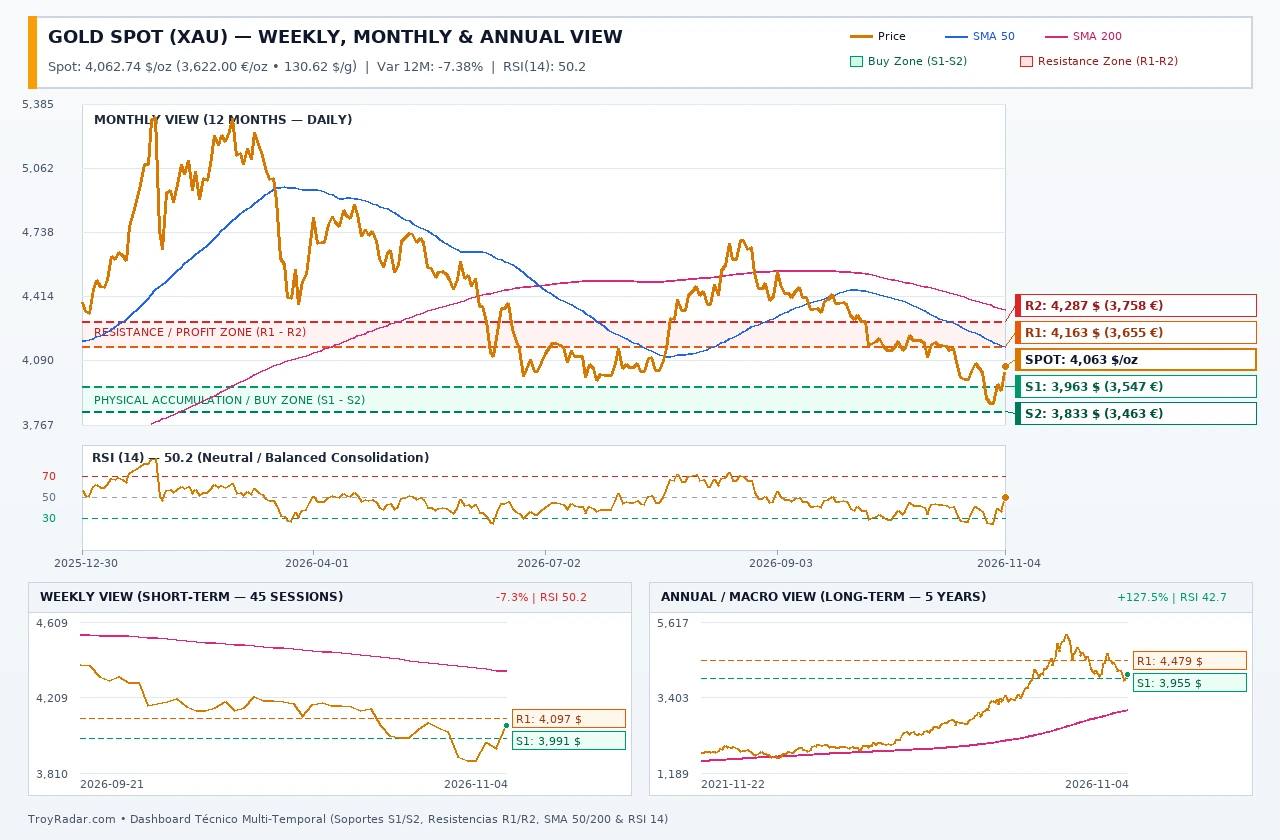
🥇 Oro Spot (3,624 €/oz | 4,067 $/oz | 116.53 €/g): RSI(14) en 50.4 (Bajista / Fase Correctiva). Primer soporte de compra en 3,547 €/oz (3,963 $) y resistencia inmediata en 3,655 €/oz.
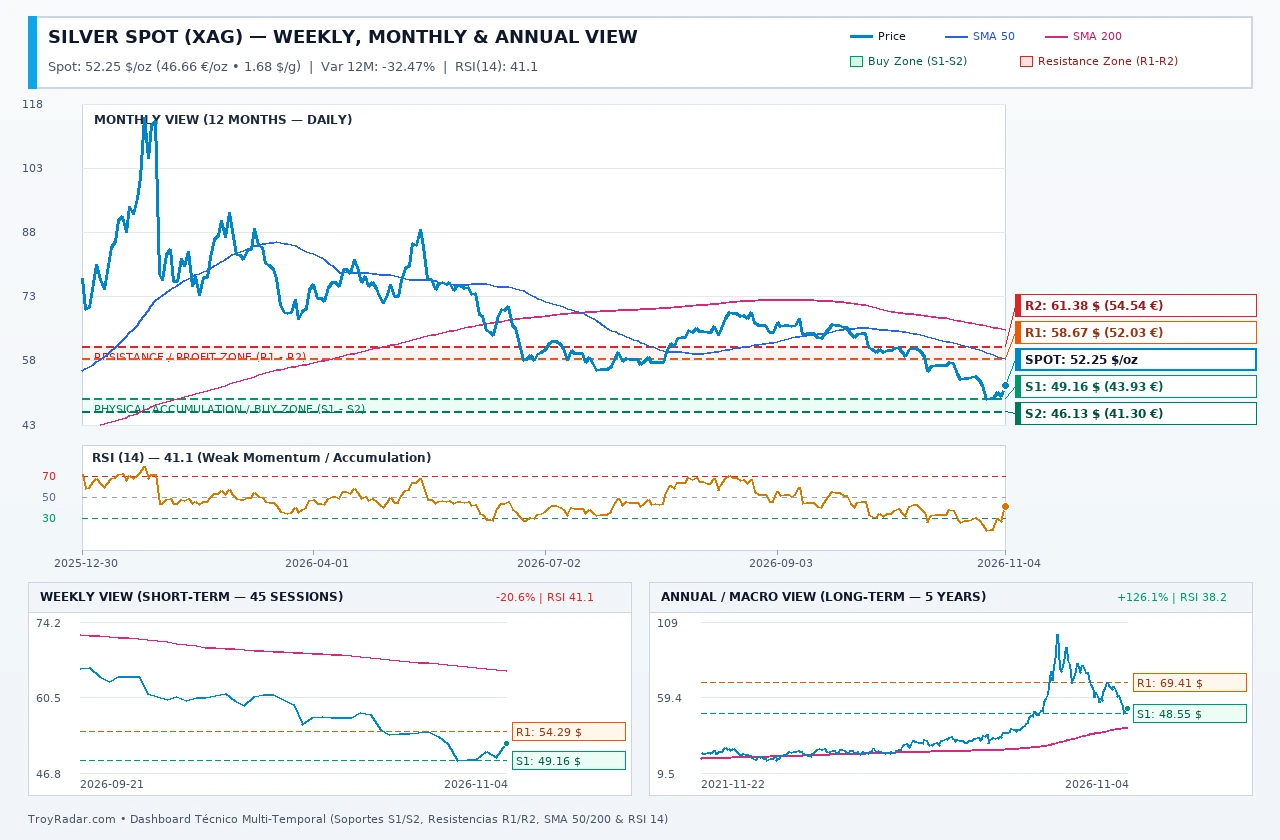
🥈 Plata Spot (46.66 €/oz | 52.25 $/oz | 1.50 €/g): RSI(14) en 41.6 (Bajista / Fase Correctiva). Zona clave de acumulación en 43.93 €/oz (49.16 $) y techo técnico en 52.03 €/oz.
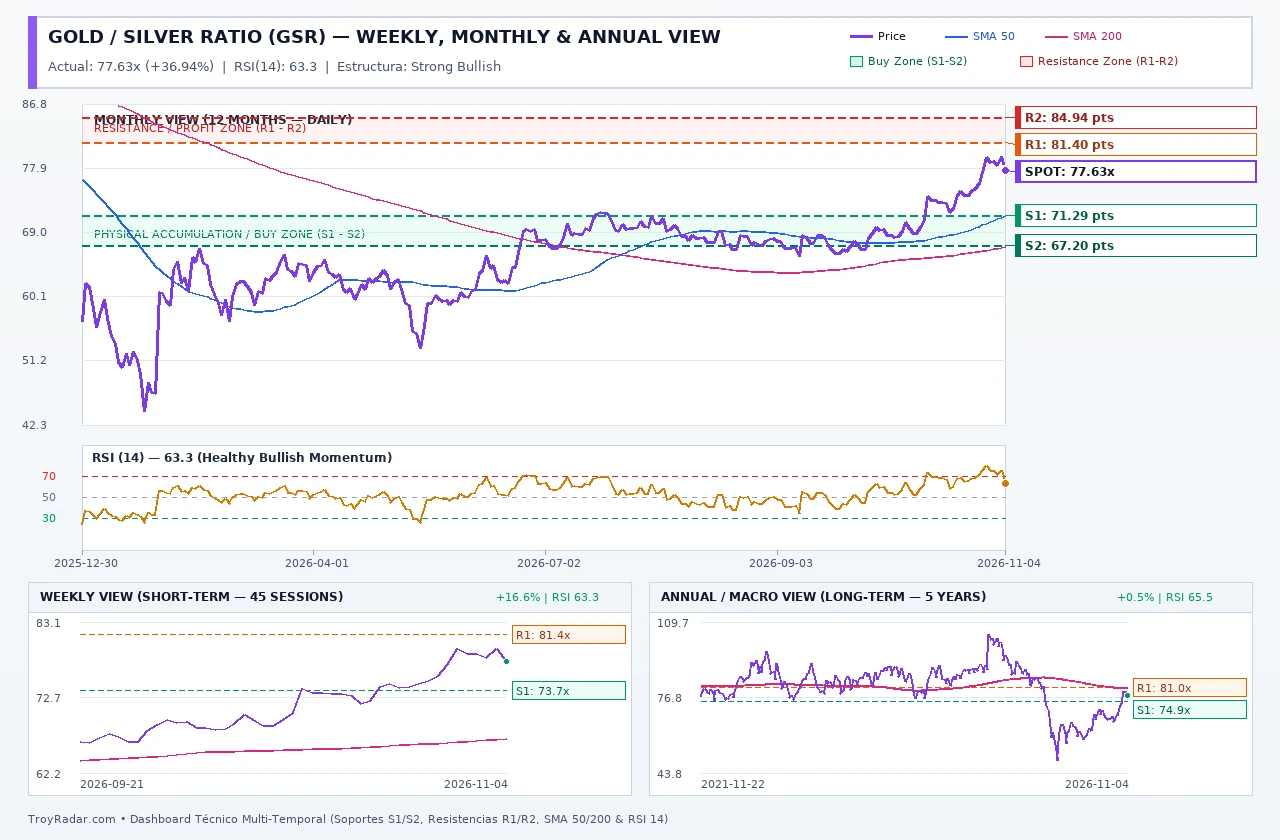
⚖️ Ratio Oro/Plata (77.68x): RSI en 63.6. Soporte de rotación en 71.3x y resistencia superior en 81.4x.
1. Matriz Cuantitativa Multi-Temporal y Traducción a Mostrador Físico
Antes de entrar en el detalle de cada gráfico, aquí tienes el cuadro maestro con todos los soportes (S1 y S2), resistencias (R1 y R2) y medias móviles de 50 y 200 sesiones calculados en ambas divisas y unidades de peso, seguido de la proyección real de precios en tiendas:
🛒 Traducción a Mostrador Físico: ¿Qué costarán las monedas y lingotes en S1 y S2?
Cruzamos los soportes técnicos S1 y S2 (Visión Mensual EUR) con los productos reales de menor prima verificados hoy en las tiendas de nuestro comparador:
Formato / Pieza de Referencia
Tienda (Menor Prima)
Precio Hoy en Tienda
Estimado en Soporte S1
Estimado en Soporte S2
Alerta 1-Clic
🪙 Moneda Oro 1 oz (31,10g) Moneda de ORO Krugerrand de Sudáfrica de 1oz. Varios años.
2. Análisis Técnico del Oro (XAU/EUR y XAU/USD): Soportes y Medias Móviles
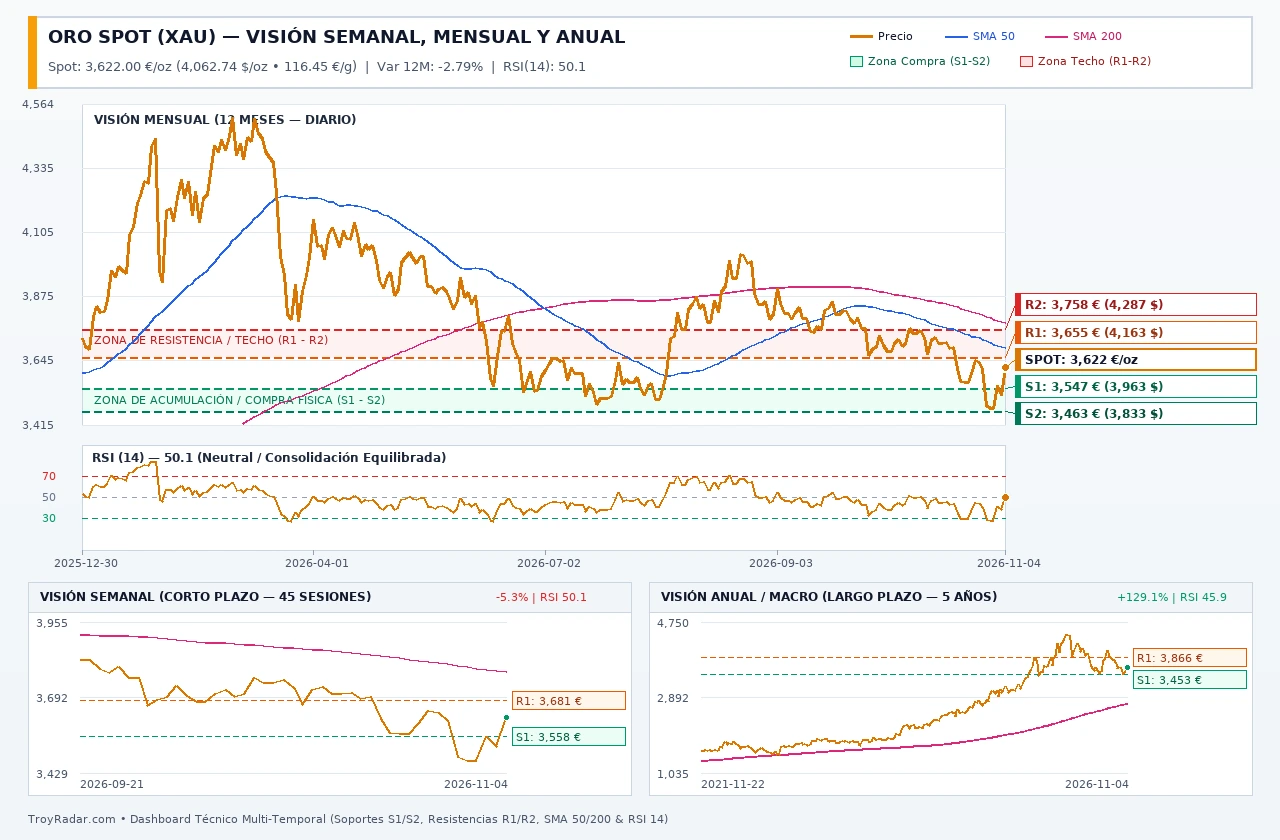
Dashboard 3-en-1 del Oro Spot (Visión Mensual, Semanal y Anual) con zonas sombreadas de compra (S1-S2), resistencias (R1-R2), SMA 50/200 y RSI(14).
En la visión mensual de 12 meses, el oro cotiza en torno a los 3,624 €/oz (4,067 $/oz), lo que equivale a 116.53 €/g en el mercado europeo. La media móvil de 50 sesiones (SMA 50) actúa como nivel de referencia dinámico en 3,693 €/oz (4,163 $/oz), mientras que la directriz institucional de 200 sesiones (SMA 200) pasa por los 3,782 €/oz (4,350 $/oz).
Para el comprador de monedas y lingotes físicos, la primera zona táctica de entrada (Soporte S1) se ubica en los 3,547 €/oz (114.03 €/g | 3,963 $/oz). Si el mercado experimentase una toma de beneficios más profunda, el suelo estructural S2 en 3,463 €/oz (111.33 €/g) activa la banda verde de acumulación fuerte.
3. Análisis Técnico de la Plata (XAG/EUR y XAG/USD): Zonas de Acumulación
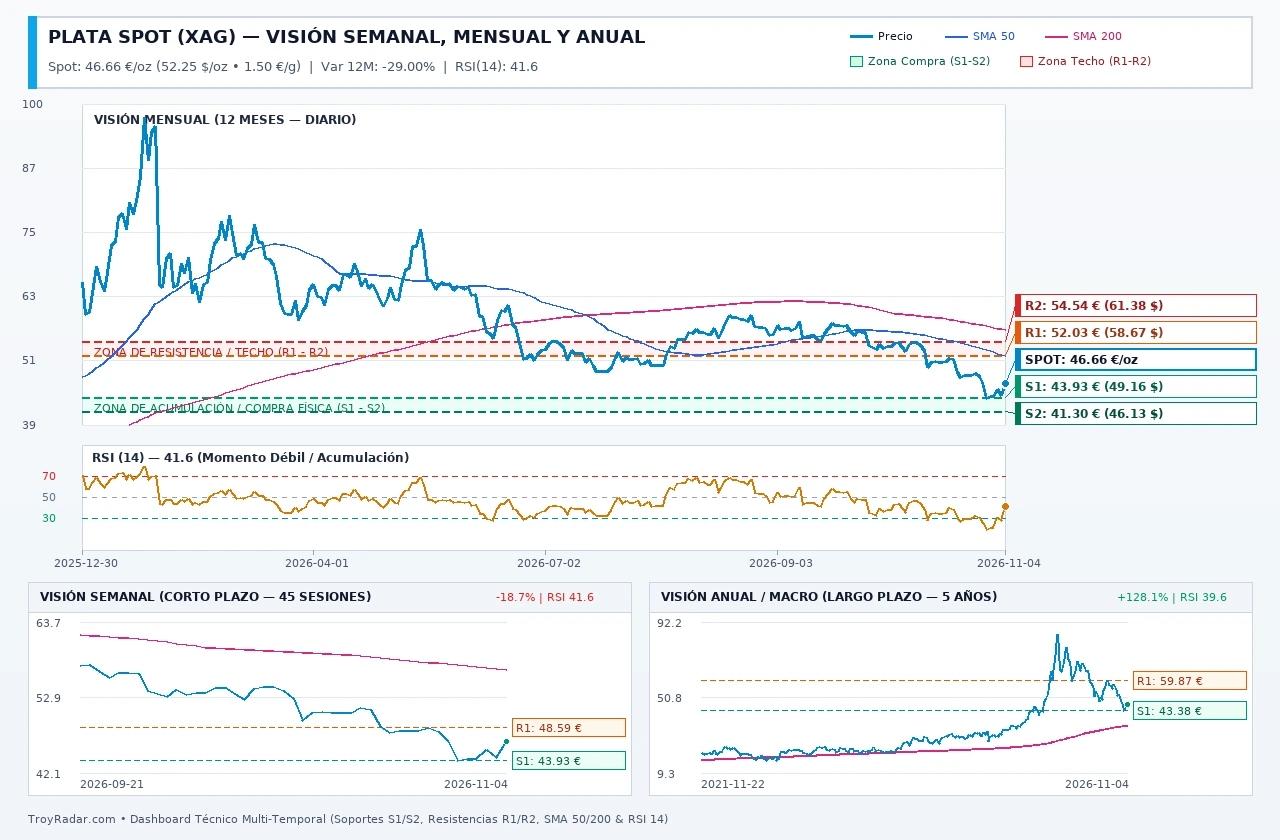
Dashboard 3-en-1 de la Plata Spot con banda sombreada de compra (S1-S2), R1/R2, SMA 50/200 y oscilador RSI(14).
La plata presenta su habitual mayor volatilidad relativa (beta), situándose en 46.66 €/oz (52.25 $/oz | 1.50 €/g) con una lectura de RSI(14) de 41.6. El soporte inmediato S1 se encuentra en 43.93 €/oz (49.16 $/oz) y el soporte secundario S2 en 41.30 €/oz (46.13 $/oz).
Por la parte superior, la superación en cierre semanal de la resistencia R1 en 52.03 €/oz (58.67 $/oz) abriría el camino hacia el objetivo alcista R2 en 54.54 €/oz (61.38 $/oz).
4. El Ratio Oro/Plata (GSR) bajo la Lupa Técnica
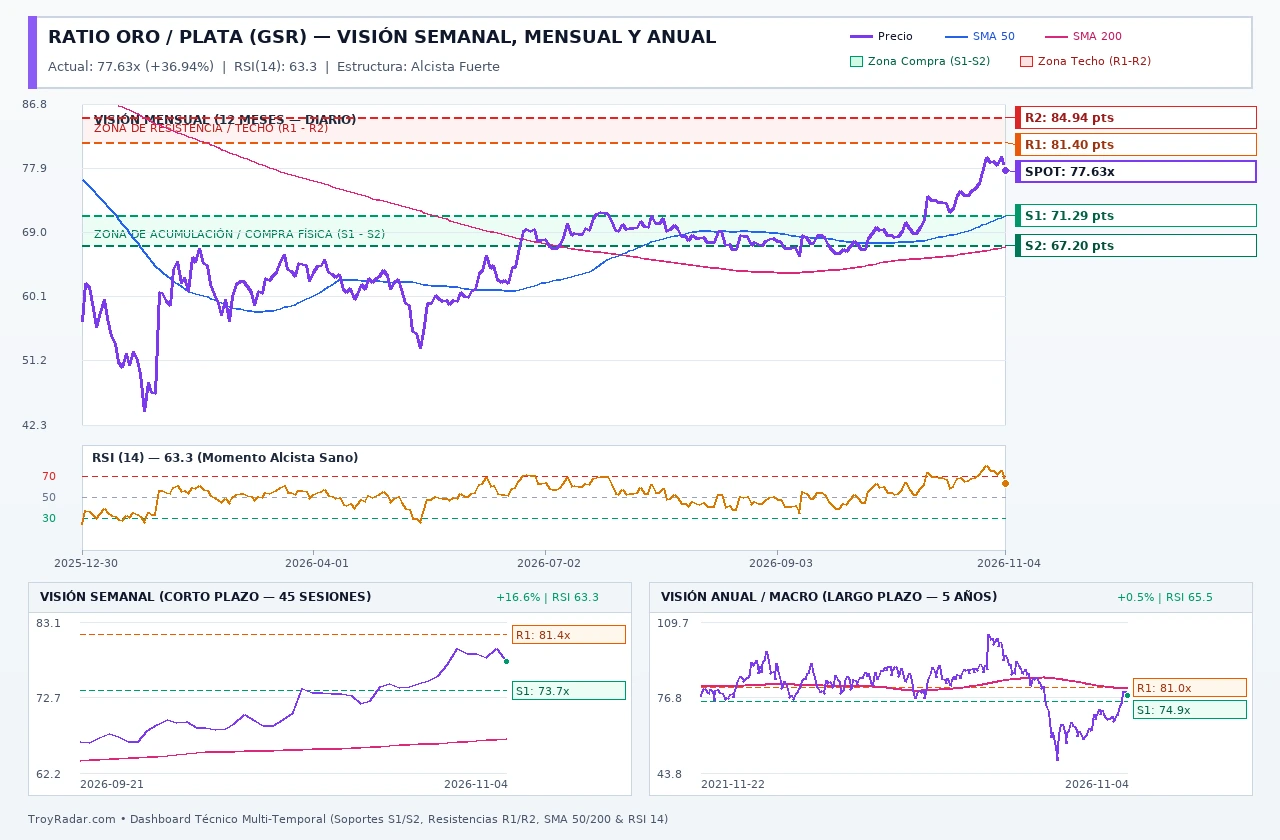
Evolución técnica multi-temporal del Ratio Oro/Plata (GSR) con soportes, resistencias y medias móviles.
El Ratio Oro/Plata marca actualmente 77.68 onzas de plata por cada onza de oro. Técnicamente, mientras el ratio se mantenga en la banda entre el soporte S1 (71.3x) y la resistencia R1 (81.4x), cualquier acercamiento a la zona alta del canal favorece tácticamente sobreponderar compras en plata frente a oro.
We kick off the week dissecting the technical structure of Gold (XAU), Silver (XAG), and the Gold/Silver Ratio (GSR) across both US Dollars ($/oz & $/g) and Euros (€/oz & €/g), combining Weekly (short-term), Monthly (12-month), and Annual (5-year macro) horizons with real retail dealer pricing.
⚡ Weekly Technical Traffic Light (Oct 28 to Nov 04, 2026)
🥇 Gold Spot (4,067 $/oz | 3,624 €/oz): RSI(14) at 50.4 (Bearish / Corrective Phase). Primary support S1 at 3,963 $/oz (3,547 €/oz) and immediate resistance R1 at 4,163 $/oz.
🥈 Silver Spot (52.25 $/oz | 46.66 €/oz): RSI(14) at 41.6 (Bearish / Corrective Phase). Key accumulation support S1 at 49.16 $/oz (43.93 €/oz) and resistance R1 at 58.67 $/oz.
⚖️ Gold/Silver Ratio (77.68x): RSI at 63.6. Key floor S1 at 71.3x and ceiling R1 at 81.4x.
1. Multi-Timeframe Technical Matrix & Physical Store Price Translation
Gold is currently trading at 4,067 $/oz (3,624 €/oz | 116.53 €/g). The 50-day moving average stands at 4,163 $/oz while the institutional 200-day moving average provides structural backing at 4,350 $/oz (3,782 €/oz). Physical stackers should monitor S1 support at 3,963 $/oz and S2 structural floor at 3,835 $/oz.
3. Silver Technical Analysis (XAG/USD & XAG/EUR)
Silver trades at 52.25 $/oz (46.66 €/oz) with an RSI(14) reading of 41.6. Immediate buying support S1 sits at 49.16 $/oz (43.93 €/oz), while a breakout above R1 (58.67 $/oz) targets R2 at 61.38 $/oz.
4. Gold/Silver Ratio (GSR) Technical Outlook
At 77.68x, the Gold/Silver Ratio remains bounded between S1 support at 71.3x and R1 resistance at 81.4x.
Utilizamos cookies propias y de terceros para asegurar el correcto funcionamiento de TroyRadar y guardar
tus preferencias de tema visual. Al continuar navegando, aceptas su uso legal.
⚡
Nuevos precios disponiblesHay cotizaciones actualizadas en el comparador.