✍️ Analista TroyRadar📅 26 de octubre de 2026⏱️ 6 min read👁️ 41 lecturas
📑Table of Contents
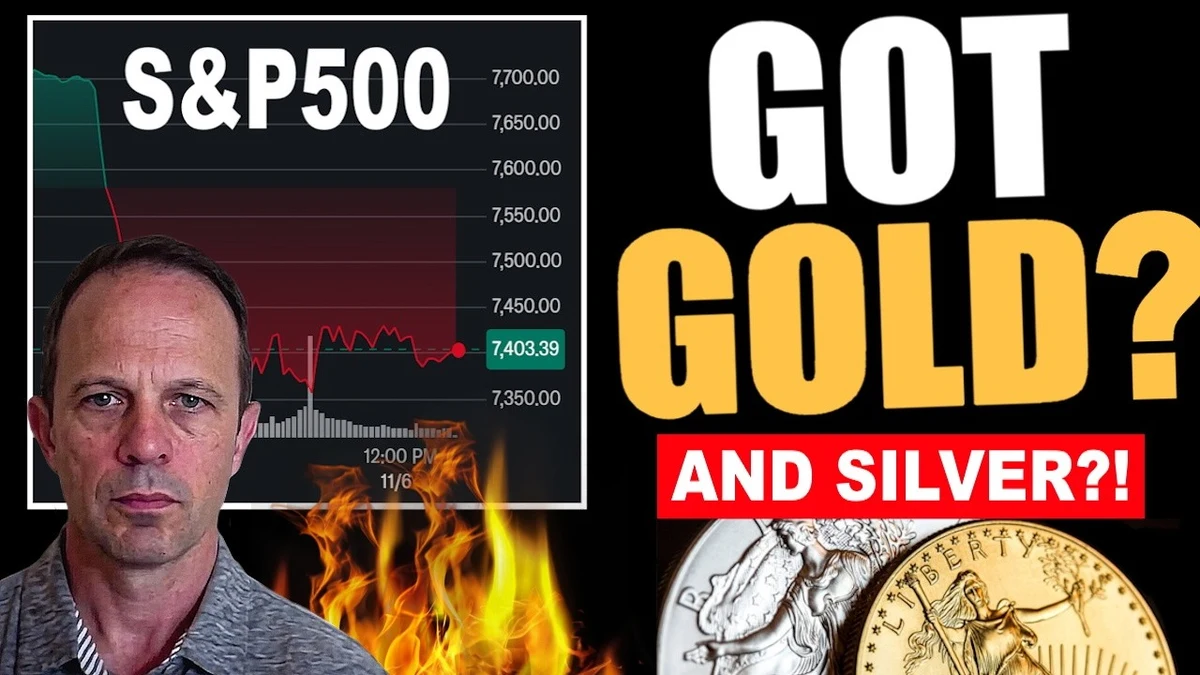
El reciente análisis publicado bajo el título "GOLD 'The Game Is Totally Rigged': Gerald Celente" por Especialista en Metales plantea un debate de enorme calado para quienes gestionan metales preciosos físicos como escudo patrimonial. En un contexto donde la volatilidad de los mercados financieros y la pérdida sostenida del poder adquisitivo de las divisas fiat marcan la agenda, diseccionar las afirmaciones de los creadores y contrastarlas con los precios reales de los distribuidores es la diferencia entre una compra rentable y una decisión impulsiva.
📌 Puntos Clave del Análisis
Diagnóstico de la Fuente: Especialista en Metales examina cómo las tensiones de oferta y demanda impactan en las decisiones de acumulación de oro y plata física.
Soportes Spot de Referencia: El oro cotiza en 114.83 €/g y la plata en 1.53 €/g, con un Ratio Oro/Plata de 75.05 que condiciona la estrategia de rotación.
Dispersión de Primas: El sobreprecio comercial que aplican los distribuidores sobre el valor spot varía hasta un 6% entre tiendas para el mismo producto exacto.
Enfoque Pragmático: Proteger el patrimonio exige compras escalonadas (DCA), verificación métrica rigurosa y selección de piezas con alta liquidez de reventa.
🟡 Spot Oro de Referencia114.83 €/g
⚪ Spot Plata de Referencia1.53 €/g
⚖️ Ratio Oro / Plata (GSR)75.05 (Ventana Histórica de Valor)
"La diferencia fundamental entre especular en contratos de papel y proteger el patrimonio familiar radica en poseer el metal físico en mano, eliminando por completo el riesgo de contraparte institucional."
— Reflexión central destacada por Especialista en Metales en su análisis sobre GOLD 'The Game Is Totally Rigged': Gerald Celente
1. Diagnóstico de la Publicación de Especialista en Metales y Contexto de Mercado
El núcleo argumental del análisis gira en torno a cómo los inversores deben interpretar las señales de estrés en el sistema financiero tradicional. Quienes acumulan metales preciosos no buscan una rentabilidad especulativa a corto plazo, sino la seguridad de poseer un activo tangible sin riesgo de contraparte ni riesgo de quiebra institucional.
A lo largo de su exposición, el autor enfatiza que los vaivenes de los contratos de futuros de papel en Nueva York o Londres a menudo no reflejan la verdadera disponibilidad de producto físico en las tiendas. Mientras los contratos en papel se negocian con un elevado apalancamiento, los distribuidores mayoristas y minoristas ajustan sus primas en función de las dificultades reales para reponer stock de refinerías certificadas.
Desde la perspectiva editorial de TroyRadar, coincidimos plenamente con la premisa de que el inversor físico debe desacoplar el ruido mediático diario de los fundamentales de acumulación a largo plazo. Mantener una disciplina matemática al medir el coste por gramo neto adquirido es el único camino para asegurar una posición sólida.
2. Radiografía de Precios Spot: Oro vs Plata en el Escenario Actual
El termómetro clave para determinar qué metal ofrece una mejor relación riesgo/retorno en este momento sigue siendo el Ratio Oro/Plata (GSR). Con un valor actual situado en 75.05, el mercado continúa otorgando a la plata un descuento relativo sustancial frente al oro cuando se compara con los promedios históricos del siglo XX (situados en torno a 50:1).
Cuando el ratio se expande a cotas elevadas, la plata física tiende a comportarse como un activo de alta beta: experimenta mayores caídas durante fases de corrección, pero protagoniza subidas porcentualmente mucho más agresivas cuando la demanda de refugio y la demanda industrial se alinean simultáneamente.
⚖️
¿Oro o Plata hoy? Consulta el Recomendador Analítico de TroyRadar
Nuestro modelo cuantitativo compara el ratio actual frente a sus medias históricas y te indica el peso táctico recomendado para cada metal en tu cartera.
3. Monedas Bullion frente a Lingotes: Comparativa de Primas y Liquidez
Uno de los errores más comunes que comete el comprador primerizo es adquirir piezas fijándose únicamente en el renombre de la marca sin calcular el sobreprecio porcentual (prima) respecto a la cotización spot en directo. En el caso de las monedas de inversión (bullion) como el Krugerrand sudafricano, la Filarmónica de Viena o la Britannia británica, la prima habitual en distribuidores líderes suele oscilar entre el 3% y el 6% en oro, mientras que en plata se ve incrementada por el impacto fiscal del IVA.
La siguiente tabla refleja las mejores oportunidades de menor sobreprecio detectadas en tiempo real por el rastreador de TroyRadar entre los principales comercios auditados:
⚡ Oportunidades Destacadas del Mercado (Menor Prima % en Tiendas)
Producto
Tienda
Precio
Prima %
Fecha Registro
Medalla de Oro Visita Juan Carlos I a México – 1 oz – México – 1978 – Recomprada
La Dobla Bullion
3664.35 €
+0.49%
📅 22 de octubre de 2026
Moneda de Oro México 50 Pesos Años Varios
Andorrano Joyería
4412.31 €
+1.14%
📅 22 de octubre de 2026
Moneda de Oro Krugerrand-1 oz.-Sudáfrica-Varios Años
The Gold House
3643.99 €
+1.15%
📅 23 de octubre de 2026
1869 – 1905 – 1 Peseta de Plata – ESPAÑA
La Dobla Bullion
6.64 €
+1.44%
📅 23 de octubre de 2026
1994 – 2009 – 2000 Pesetas / 12 Euros de Plata – ESPAÑA
4. Radar de Oportunidades en Distribuidores Verificados
La verdadera prueba de fuego de una posición en metales físicos no es el precio al que se compra, sino la facilidad y el descuento con el que se puede liquidar en caso de necesidad. Las monedas de 1 onza con reconocimiento internacional disfrutan de spreads de recompra muy estrechos, ya que cualquier comerciante o particular las reconoce al instante y verifica sus dimensiones métricas sin coste adicional.
Por el contrario, los lingotes de marcas menos conocidas o los formatos no sellados por refinerías Good Delivery de la LBMA pueden sufrir penalizaciones en el precio de recompra o requerir ensayos destructivos. Antes de añadir una pieza a tu custodia, recomendamos verificar siempre su peso y diámetro con un calibre de precisión y una báscula calibrada.
🧮
Simulador de Compra Física: ¿Cuánto metal adquieres hoy?
Selecciona o introduce un presupuesto en euros para calcular el metal fino estimado a precios de mercado actuales:
🟡 Oro Físico (prima media ~3,5%)~25.24 g (0.81 oz troy)
⚪ Plata Física (prima + IVA incluido ~22%)~1607.2 g (51.7 oz troy)
* Estimación orientativa basada en spot en vivo (114.83 €/g oro | 1.53 €/g plata) y primas ponderadas de distribuidores líderes.
5. Veredicto y Conclusiones Prácticas para el Inversor
En conclusión, el análisis de GOLD 'The Game Is Totally Rigged': Gerald Celente confirma que nos encontramos en un ciclo donde la paciencia táctica y la optimización de costes comerciales son las mejores aliadas del inversor. Lejos de intentar adivinar los máximos o mínimos exactos de la cotización, la estrategia que ha demostrado mayor eficacia a lo largo de décadas es el Dollar-Cost Averaging (DCA): realizar compras periódicas fijas que promedien el precio de adquisición y eliminen el factor emocional.
📊
Calculadora y Comparador de Primas en Tiempo Real
Introduce cualquier moneda o lingote y compara al segundo el sobreprecio exacto que cobra cada distribuidor antes de tramitar tu pedido.
¿Es buen momento para comprar oro con las cotizaciones actuales?
El oro cumple una función de preservación de poder adquisitivo a largo plazo. Históricamente, promediar entradas periódicas (DCA) ha protegido a los inversores de la volatilidad a corto plazo mucho mejor que intentar sincronizar el mercado.
¿Qué piezas ofrecen la prima más ajustada en las tiendas?
En oro, las monedas bullion clásicas de 1 onza (Krugerrand, Filarmónica, Britannia) y los lingotes de 100g o más suelen ofrecer las primas más bajas (habitualmente por debajo del 4%). En plata, los tubos de 20 o 25 monedas de 1 oz optimizan el coste logístico y el sobreprecio.
¿Cómo comprobar la autenticidad de una pieza física?
Verifica primero el diámetro, grosor y peso exactos con los parámetros oficiales de la ceca emisora. Puedes utilizar nuestra herramienta Test de Densidad por Gravedad Específica para verificar que el metal coincide exactamente con oro o plata pura.
The recent briefing entitled "GOLD 'The Game Is Totally Rigged': Gerald Celente" by Especialista en Metales brings forward a crucial strategic discussion for private bullion stackers preserving purchasing power. In a macro landscape defined by sovereign debt expansion and persistent currency debasement, dissecting creator insights and cross-referencing them with live physical dealer quotes is what separates disciplined value accumulation from impulsive retail decisions.
📌 Key Takeaways
Core Analysis: Especialista en Metales reviews how supply and demand dislocations are impacting physical bullion stackers.
Live Spot Anchors: Gold trades at 114.83 €/g and silver at 1.53 €/g, setting the Gold-to-Silver Ratio at 75.05.
Dealer Spread Variance: Retail markups over spot price vary up to 6% across leading European dealers for the exact same mint coin.
⚖️ Gold / Silver Ratio (GSR)75.05 (Historical Value Window)
"The difference between speculating on leveraged paper contracts and securing real wealth lies in holding physical metal in hand, eliminating institutional counterparty default risk entirely."
— Key editorial takeaway from Especialista en Metales in their analysis of GOLD 'The Game Is Totally Rigged': Gerald Celente
1. Video Breakdown from Especialista en Metales and Strategic Market Context
The core premise of the analysis revolves around how investors should navigate structural tensions in the conventional banking system. Physical bullion stackers do not seek short-term speculative beta; they seek the certainty of owning unencumbered, tangible wealth free from counterparty risk and institutional insolvency.
Throughout the broadcast, the presenter underscores that paper spot contracts negotiated on COMEX or the LBMA do not always mirror true retail product availability. While paper claims trade on high leverage, physical distributors adjust their retail premiums in response to actual mint refilling bottlenecks and refinery delivery times.
From TroyRadar's quantitative standpoint, we strongly concur with the principle that long-term bullion accumulators must filter out daily news cycle noise and focus on real acquisition math: maximizing pure fine grams per dollar or euro deployed.
2. Live Spot Benchmark Analysis: Gold vs Silver Pricing Dynamics
The premier metric to determine whether gold or silver presents superior risk-adjusted value remains the Gold-to-Silver Ratio (GSR). At current levels of 75.05, physical silver continues to trade at a substantial historical discount relative to monetary gold when judged against 20th-century averages (~50:1).
When the ratio hovers at elevated bands, physical silver behaves as a high-beta monetary asset: enduring sharper declines in risk-off corrections, but delivering far more explosive percentage gains when monetary easing and industrial consumption coincide.
⚖️
Gold or Silver Today? Consult the TroyRadar Quantitative Recommender
Our quantitative model compares current GSR levels against long-term historical moving averages to recommend optimal asset weighting for your bullion reserves.
3. Bullion Coins vs. Bars: Retail Premium Spreads and Exit Liquidity
A frequent error among novice investors is selecting bullion products based purely on mint prestige without calculating the exact percentage premium over the underlying spot melt value. For benchmark sovereign bullion coins such as the South African Krugerrand, Austrian Philharmonic or British Britannia, competitive European dealer spreads typically range between 3% and 6% for gold.
The table below details real-time opportunities with the tightest retail markups currently tracked by TroyRadar across verified dealers:
⚡ Real-Time Bullion Deals in European Dealers (Lowest Premium %)
Product / Bullion
Dealer / Store
Price
Premium %
Recorded
Medalla de Oro Visita Juan Carlos I a México – 1 oz – México – 1978 – Recomprada
La Dobla Bullion
3664.35 €
+0.49%
📅 October 22, 2026
Moneda de Oro México 50 Pesos Años Varios
Andorrano Joyería
4412.31 €
+1.14%
📅 October 22, 2026
Moneda de Oro Krugerrand-1 oz.-Sudáfrica-Varios Años
The Gold House
3643.99 €
+1.15%
📅 October 23, 2026
1869 – 1905 – 1 Peseta de Plata – ESPAÑA
La Dobla Bullion
6.64 €
+1.44%
📅 October 23, 2026
1994 – 2009 – 2000 Pesetas / 12 Euros de Plata – ESPAÑA
4. European Dealer Opportunity Radar: Finding Value Windows
The true litmus test of physical bullion allocation is not merely the initial purchase price, but how seamlessly and competitively that metal can be liquidated if capital reallocation is required. Recognized 1-ounce government bullion coins command the tightest bid-ask buyback spreads, as certified retailers and private stackers verify their dimensions instantaneously without secondary assay fees.
In contrast, generic bars from lesser-known private mints or unsealed cast ingots can face buyback discounts or require costly destructive testing. Before putting any piece into permanent vault custody, always verify its weight, diameter and thickness against official mint specifications.
🧮
Physical Bullion Allocation Calculator
Select or enter an investment budget to see estimated fine ounces and grams at live retail premiums:
🟡 Fine Gold (~3.5% avg retail premium)~25.24 g (0.81 oz troy)
⚪ Fine Silver (VAT + premium included)~1607.2 g (51.7 oz troy)
* Estimación orientativa basada en spot en vivo (114.83 €/g oro | 1.53 €/g plata) y primas ponderadas de distribuidores líderes.
5. Tactical Takeaways and Actionable Investor Conclusions
In conclusion, the thesis presented in GOLD 'The Game Is Totally Rigged': Gerald Celente reinforces that tactical discipline and dealer cost optimization are an investor's greatest advantages. Rather than attempting to guess exact intraday market tops or bottoms, the strategy with decades of proven efficacy is Dollar-Cost Averaging (DCA): scheduling recurring, fixed capital purchases that smooth acquisition costs and remove psychological friction.
📊
Live Premium Calculator and Dealer Comparison
Compare retail premiums across top European bullion dealers before placing any retail order to maximize fine metal per euro.
Is it a good time to buy gold at current price levels?
Gold serves as long-term purchasing power insurance. Historically, dollar-cost averaging (DCA) has shielded wealth from macroeconomic volatility far more reliably than attempting to time cyclical pullbacks.
Which bullion formats carry the lowest dealer markups?
In gold, standard 1 oz sovereign coins (Krugerrand, Philharmonic, Britannia) and 100g+ cast bars consistently offer the tightest premiums (often below 4%). In silver, 20 or 25-coin mint tubes optimize packaging overhead and shipping costs.
How can I verify physical bullion authenticity at home?
Start by measuring diameter, thickness and weight with precision calipers and a calibrated scale. For non-destructive verification of pure metal density, use our interactive Specific Gravity Density Test tool.
Utilizamos cookies propias y de terceros para asegurar el correcto funcionamiento de TroyRadar y guardar
tus preferencias de tema visual. Al continuar navegando, aceptas su uso legal.
⚡
Nuevos precios disponiblesHay cotizaciones actualizadas en el comparador.