Silver Price Plunge: Real Market Opportunity or Trap?
✍️ Analista TroyRadar📅 23 de octubre de 2026⏱️ 8 min read👁️ 46 lecturas
📑Table of Contents
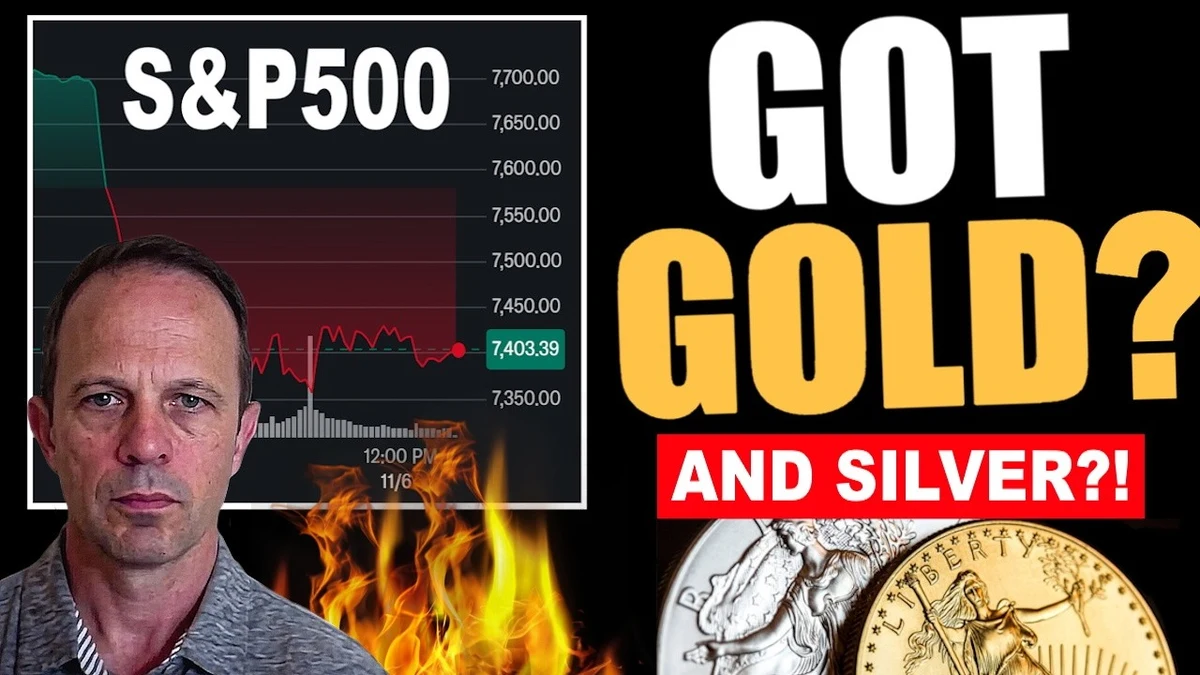
El canal de YouTube Silver Dragons ha vuelto a poner el foco en la cotización de la plata tras registrar mínimos anuales, un movimiento que ha desatado una oleada de compras físicas y dudas severas entre los ahorradores. Como analistas senior en TroyRadar, consideramos imprescindible desenterrar los datos reales detrás de este desplome, separando el sensacionalismo habitual de las plataformas digitales de la realidad tangible a la que se enfrenta cualquier persona que acude hoy a una ventanilla de metales preciosos en busca de refugio.
🟡 Spot Oro de Referencia114.86 €/g
⚪ Spot Plata de Referencia1.55 €/g
⚖️ Ratio Oro / Plata (GSR)74.1 (Ventana Histórica de Valor)
📌 Puntos Clave del Análisis / Key Takeaways
Tesis Principal: La plata ha tocado mínimos anuales según los gráficos oficiales, provocando un desabastecimiento puntual en algunas tiendas especializadas debido a la euforia compradora.
Dato / Argumento Clave 1: Se recuerda la fuerte caída vivida en 2020 por debajo de los 12 dólares, sugiriendo que el mercado físico podría sufrir correcciones más profundas antes de consolidar una tendencia alcista firme.
Dato / Argumento Clave 2: Los distribuidores físicos confirman que los inversores minoristas están aprovechando cada recorte para acumular metal con agresividad.
Conclusión Operativa: La bajada del precio en las pantallas no siempre se traslada de forma lineal al precio final en mostrador debido a las primas comerciales.
"El precio de la plata acaba de tocar su nivel más bajo del año y da la sensación de estar en plenas rebajas, lo que ha provocado que las tiendas se queden sin stock físico porque la gente está comprando como loca."
— Silver Dragons, en su tesis audiovisual
Radiografía de una caída: Cuando el gráfico marca mínimos pero el mostrador se vacía
El creador de Silver Dragons aborda en su último contenido una paradoja clásica de los mercados de materias primas: mientras los gráficos de papel marcan un retroceso importante que sitúa al metal en la zona más baja de lo que llevamos de ejercicio, la demanda física en los mostradores de los distribuidores no deja de intensificarse. Para quien lleva años acumulando onzas, este comportamiento no es nuevo. Los especuladores de papel mandan en las cotizaciones de futuros en papel, pero la realidad de la calle muestra un apetito voraz por el metal tangible.
En el contexto europeo actual, con una cotización de referencia en torno a los 1.55 € por gramo de plata, cualquier corrección a la baja genera un dilema inmediato en el inversor prudente. ¿Estamos ante el suelo definitivo de mercado o es simplemente una sacudida temporal orquestada por los grandes actores financieros? Desde nuestra perspectiva cuantitativa, mirar exclusivamente el precio spot es un error de novato. Lo que realmente define la salud del mercado es la facilidad para conseguir producto físico y el sobreprecio real que se paga por encima de la cotización oficial.
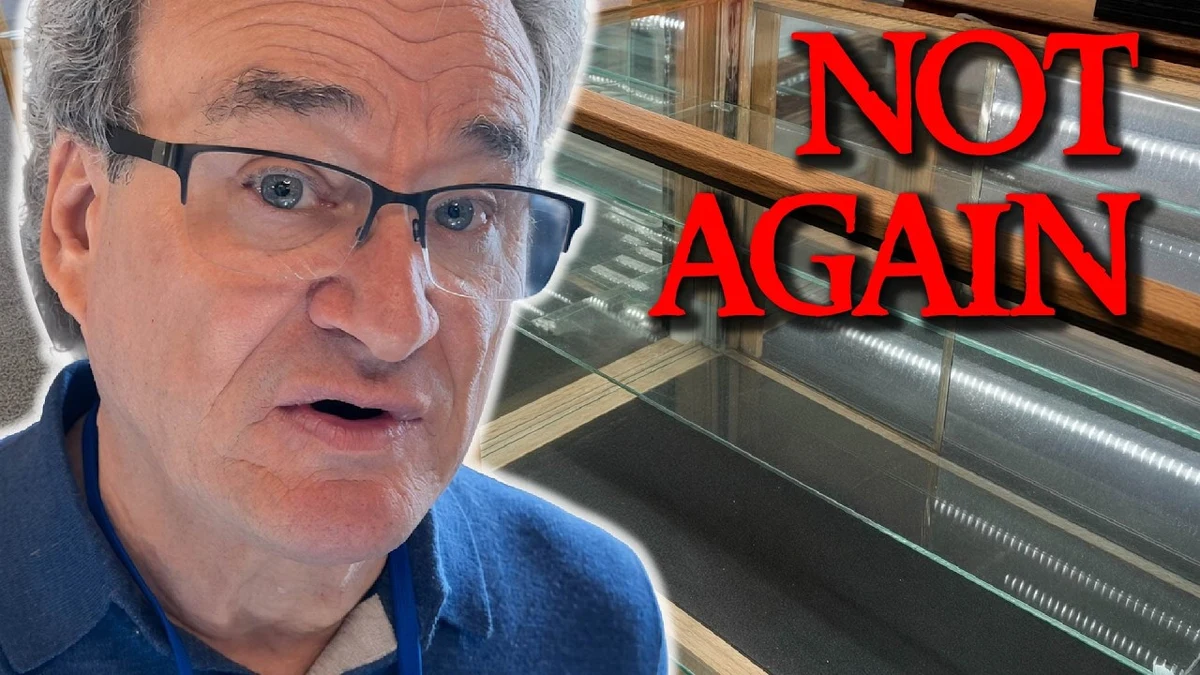
Cuando los canales de distribución informan de roturas de stock o de un ritmo de ventas inusual ante una bajada de precios, nos indica que el inversor particular comprende perfectamente la diferencia entre el papel y el metal real. Mientras los analistas de salón discuten sobre soportes técnicos en gráficos diarios, el ahorrador de a pie utiliza las correcciones para reforzar su posición patrimonial a largo plazo, protegiéndose de la constante pérdida de poder adquisitivo del dinero fiduciario.
⚡ Oportunidades Destacadas del Mercado (Menor Prima % en Tiendas)
Producto
Tienda
Precio
Prima %
Fecha Registro
Medalla de Oro Visita Juan Carlos I a México – 1 oz – México – 1978 – Recomprada
La Dobla Bullion
3664.35 €
+0.49%
📅 22 de octubre de 2026
Moneda de Oro México 50 Pesos Años Varios
Andorrano Joyería
4412.31 €
+1.14%
📅 22 de octubre de 2026
Moneda de Oro Krugerrand-1 oz.-Sudáfrica-Varios Años
The Gold House
3643.99 €
+1.15%
📅 23 de octubre de 2026
1869 – 1905 – 1 Peseta de Plata – ESPAÑA
La Dobla Bullion
6.64 €
+1.44%
📅 23 de octubre de 2026
1994 – 2009 – 2000 Pesetas / 12 Euros de Plata – ESPAÑA
La memoria de 2020 y el miedo a los retrocesos profundos en el metal
Uno de los aspectos más interesantes planteados en el vídeo es la comparativa con los compases iniciales de 2020, cuando el pánico global arrastró a la plata a cotizar momentáneamente por debajo de los 12 dólares por onza. Aquel episodio quedó grabado en la memoria colectiva de la comunidad de inversores en metales físicos. La lección principal de aquel desplome repentino fue doble: por un lado, demostró la extrema volatilidad y manipulación a corto plazo que sufre este mercado; por otro, evidenció que los precios de derribo duran apenas un suspiro en los mostradores físicos.
Si evaluamos la posibilidad de que la cotización vuelva a visitar zonas de precios muy deprimidas en el futuro, debemos analizar la estructura de costes de la minería primaria y secundaria. Producir una onza de plata hoy en día es significativamente más caro que hace una década debido a la inflación de costes energéticos, maquinaria y personal. Por tanto, los escenarios de precios excesivamente bajos en el papel chocan frontalmente contra la realidad económica de las explotaciones mineras, las cuales ven reducidos sus márgenes drásticamente si el metal cae por debajo de ciertos umbrales de rentabilidad.
💡
Monitor de Cotización en Directo TroyRadar
Comprueba en tiempo real el precio spot actual del oro y la plata, así como el ratio histórico para planificar tus compras con datos exactos.
Para el inversor europeo, esto significa que cualquier corrección profunda debe interpretarse con cautela pero sin parálisis. Esperar a que el mercado caiga a niveles irreales puede hacer que te quedes fuera de juego, especialmente si los distribuidores físicos se quedan sin inventario y las primas comerciales se disparan para compensar la escasez de oferta disponible. La historia demuestra que el mejor momento para acumular es cuando hay tranquilidad y el metal fluye sin sobresaltos en las tiendas.
La disociación entre el precio spot y el coste real en ventanilla
El vídeo pone sobre la mesa una realidad incontestable que todo comprador físico experimenta en carne propia: el precio que ves en las pantallas no es el precio al que puedes comprar el metal. Cuando la cotización oficial cae bruscamente, los distribuidores no siempre pueden o quieren bajar sus precios de venta al público en la misma proporción, ya que sus propios costes de reposición, transporte, seguro y acuñación se mantienen rígidos o incluso aumentan debido a la avalancha de pedidos.
Este fenómeno provoca que las primas —el sobreprecio que pagas por encima del valor spot por cada moneda o lingote— actúen como un amortiguador. En momentos de caídas fuertes del mercado, la demanda minorista se dispara de tal manera que las casas de moneda y los grandes mayoristas sufren cuellos de botella. El resultado directo para el comprador es que el ahorro teórico que supuestamente ofrece la bajada del precio spot se esfuma parcialmente al toparnos con unas primas comerciales más elevadas debido a la tensión en el suministro.
Por esta razón, un inversor inteligente nunca debe obsesionarse con cazar el suelo exacto del mercado. Intentar comprar en el milímetro más bajo es una trampa psicológica que suele terminar en frustración o inacción. Lo verdaderamente importante es establecer una estrategia de acumulación periódica, aprovechando las correcciones para promediar costes de adquisición y asegurándose de tener siempre el metal bajo custodia propia, lejos del riesgo de contraparte del sistema financiero tradicional.
Estrategia patrimonial: ¿Cuánto metal tener y cómo gestionar el ratio oro-plata?
Hacia el final del debate planteado por el creador, se abordan cuestiones fundamentales de planificación financiera a largo plazo, como la proporción adecuada entre oro y plata dentro de una cartera patrimonial y el volumen total de metales que un particular debería poseer. Con un ratio oro-plata (GSR) situado actualmente en torno a 74.1, nos encontramos ante un escenario donde la plata históricamente mantiene un perfil de mayor infravaloración relativa frente al oro, lo que suele atraer el interés de perfiles dispuestos a asumir mayor volatilidad a cambio de un potencial de revalorización superior.
Determinar cuánto metal debes tener depende estrictamente de tu situación personal, tu nivel de ingresos, tus ahorros líquidos fuera del sistema bancario y tu grado de preocupación ante la inestabilidad macroeconómica global. Ningún asesor financiero honesto te dirá que debes volcar el 100% de tu patrimonio en lingotes, pero mantener un porcentaje relevante en activos físicos tangibles actúa como el mejor seguro contra la devaluación monetaria y las crisis sistémicas. La plata, debido a su doble condición de activo monetario e industrial, ofrece una dinámica única que requiere paciencia y una visión de largo plazo.
⚖️
¿Oro o Plata Hoy? Recomendador Cuantitativo de TroyRadar
Nuestro modelo cuantitativo compara el Ratio Oro/Plata (GSR) en tiempo real con sus medias históricas para indicarte qué metal ofrece mayor ventaja táctica de compra.
A la hora de estructurar tus compras, prioriza siempre monedas bullion de curso legal reconocidas internacionalmente (como Filarmónicas, Maples o American Eagles) frente a formatos menos líquidos, ya que garantizan una salida rápida y transparente en cualquier mercado del mundo. Evita las compras impulsivas motivadas exclusivamente por el pánico o la euforia de las redes sociales, y céntrate en construir un patrimonio sólido, verificado y libre de deudas.
🧮
Simulador de Compra Física: ¿Cuánto metal adquieres hoy?
Selecciona o introduce un presupuesto en euros para calcular el metal fino estimado a precios de mercado actuales:
🟡 Oro Físico (prima media ~3,5%)~25.24 g (0.81 oz troy)
⚪ Plata Física (prima + IVA incluido ~22%)~1586.5 g (51.0 oz troy)
* Estimación orientativa basada en spot en vivo (114.86 €/g oro | 1.55 €/g plata) y primas ponderadas de distribuidores líderes.
Preguntas Frecuentes sobre la caída de la plata y la inversión física
¿Es seguro comprar plata cuando su precio cae en los mercados internacionales?
Sí, de hecho es el momento preferido por muchos inversores experimentados, siempre que tengas en cuenta que las primas en las tiendas físicas pueden subir temporalmente debido al aumento de la demanda.
¿Por qué el precio que veo en el gráfico no coincide con lo que pago en la tienda?
El precio del gráfico (spot) corresponde al mercado mayorista de papel (futuros). El precio en tienda incluye costes de fabricación, distribución, impuestos aplicables y el margen del propio distribuidor.
¿Qué formato es mejor para empezar a acumular plata física?
Las monedas de inversión de 1 onza de cecas gubernamentales son la opción más recomendable por su alta liquidez global y facilidad de reventa frente a los lingotes grandes.
The YouTube channel Silver Dragons has once again turned the spotlight onto silver pricing after recording yearly lows, triggering a wave of physical buying and serious doubts among savers. As senior analysts at TroyRadar, we consider it essential to unearth the real data behind this drop, separating the typical sensationalism of digital platforms from the tangible reality faced by anyone walking into a precious metals counter today seeking a safe haven.
🟡 Gold Spot Benchmark114.86 €/g
⚪ Silver Spot Benchmark1.55 €/g
⚖️ Gold / Silver Ratio (GSR)74.1 (Historical Value Window)
📌 Key Takeaways
Main Thesis: Silver has touched yearly lows according to official charts, causing temporary stock shortages at specialized dealers due to buying euphoria.
Key Data / Argument 1: The sharp 2020 drop below $12 is recalled, suggesting physical markets could face deeper corrections before building a firm upward trend.
Key Data / Argument 2: Physical dealers confirm retail investors are aggressively taking advantage of every dip to accumulate metal.
Operational Conclusion: The screen price drop does not always translate linearly to retail counter prices due to commercial premiums.
"The silver price just hit its lowest price of the year and seems to be on sale right now, which has caused coin shops to sell out because stackers are buying like crazy."
— Silver Dragons, in their audiovisual thesis
Anatomy of a Drop: When Charts Show Lows While Counters Sell Out
The creator behind Silver Dragons addresses a classic commodity market paradox in their latest content: while paper charts mark a significant pullback placing the metal at yearly lows, physical demand at dealer counters continues to intensify. For seasoned stackers, this behavior is hardly new. Paper speculators rule the quote screens, but street reality shows a voracious appetite for tangible metal.
In the current European context, with a reference spot price hovering around 1.55 € per gram of silver, any downward correction generates an immediate dilemma for the prudent investor. Are we witnessing the ultimate market bottom, or is it simply a temporary shakeout orchestrated by major financial players? From our quantitative perspective, looking exclusively at the spot price is an amateur mistake. What truly defines market health is the ease of sourcing physical product and the real markup paid above the official quote.
When distribution channels report stockouts or unusual sales pacing during price drops, it indicates retail investors fully grasp the difference between paper and real metal. While armchair analysts argue over daily chart supports, everyday savers use corrections to reinforce their long-term wealth position, protecting themselves against the constant purchasing power erosion of fiat currency.
⚡ Real-Time Bullion Deals in European Dealers (Lowest Premium %)
Product / Bullion
Dealer / Store
Price
Premium %
Recorded
Medalla de Oro Visita Juan Carlos I a México – 1 oz – México – 1978 – Recomprada
La Dobla Bullion
3664.35 €
+0.49%
📅 October 22, 2026
Moneda de Oro México 50 Pesos Años Varios
Andorrano Joyería
4412.31 €
+1.14%
📅 October 22, 2026
Moneda de Oro Krugerrand-1 oz.-Sudáfrica-Varios Años
The Gold House
3643.99 €
+1.15%
📅 October 23, 2026
1869 – 1905 – 1 Peseta de Plata – ESPAÑA
La Dobla Bullion
6.64 €
+1.44%
📅 October 23, 2026
1994 – 2009 – 2000 Pesetas / 12 Euros de Plata – ESPAÑA
The Memory of 2020 and Fear of Deeper Pullbacks in the Metal
One of the most engaging aspects raised in the video is the comparison with early 2020, when global panic momentarily dragged silver below $12 per ounce. That episode remains etched in the collective memory of the physical bullion community. The primary lesson from that sudden crash was twofold: it demonstrated the extreme volatility and short-term manipulation plaguing this market, while proving that rock-bottom prices last mere moments at physical counters.
Evaluating the possibility of quotes revisiting severely depressed price zones in the future requires analyzing primary and secondary mining cost structures. Producing an ounce of silver today is significantly costlier than a decade ago due to inflation in energy, machinery, and labor. Therefore, overly low paper price scenarios clash head-on with the economic reality of mining operations, whose margins shrink drastically if the metal falls below specific profitability thresholds.
💡
TroyRadar Live Spot Monitor
Check real-time spot prices for gold and silver, along with historical ratios, to plan your purchases with exact data.
For European investors, this means any deep correction should be approached with caution rather than paralysis. Waiting for the market to drop to unrealistic levels can leave you sidelined, especially if physical dealers run out of inventory and commercial premiums spike to compensate for tight available supply. History proves the best time to accumulate is during calm periods when metal flows smoothly through shops without disruption.
The Disconnect Between Spot Price and Actual Counter Cost
The video highlights an undeniable reality experienced firsthand by every physical buyer: the price you see on screens is not the price you pay for the metal. When official quotes drop sharply, dealers cannot always lower retail selling prices in equal proportion, as their own replacement, shipping, insurance, and minting costs remain rigid or even rise due to incoming order surges.
This phenomenon causes premiums—the markup paid over spot value for each coin or bar—to act as a buffer. During steep market drops, retail demand surges so aggressively that mints and major wholesalers face bottlenecks. The direct result for buyers is that theoretical savings from spot drops partially vanish when hitting higher commercial premiums driven by supply tension.
For this reason, smart investors should never obsess over catching the absolute market bottom. Trying to buy at the lowest tick is a psychological trap usually ending in frustration or inaction. What truly matters is establishing a regular accumulation strategy, using corrections to average acquisition costs while ensuring custody remains in your own hands, far from traditional financial system counterparty risk.
Wealth Strategy: How Much Metal to Hold and Managing the Gold-Silver Ratio
Toward the end of the creator's debate, fundamental long-term financial planning questions are addressed, such as the proper gold-to-silver allocation ratio within a wealth portfolio and total metal volume individuals should hold. With the gold-silver ratio (GSR) currently sitting around 74.1, we face a scenario where silver historically maintains a profile of greater relative undervaluation against gold, attracting profiles willing to accept higher volatility for superior appreciation potential.
Determining how much metal to hold depends strictly on personal circumstances, income levels, liquid savings outside the banking system, and concern over global macroeconomic instability. No honest financial advisor will tell you to dump 100% of your wealth into bullion, but keeping a relevant percentage in tangible physical assets acts as the ultimate insurance against monetary devaluation and systemic crises. Silver, due to its dual monetary and industrial asset nature, offers unique dynamics requiring patience and long-term vision.
⚖️
Gold or Silver Today? TroyRadar Quantitative Allocator
Our quantitative model analyzes the live Gold-to-Silver Ratio (GSR) against multi-year historical averages to guide your tactical capital allocation.
When structuring purchases, always prioritize internationally recognized legal tender bullion coins (such Philharmonics, Maples, or American Eagles) over less liquid formats, guaranteeing quick and transparent exits in any global market. Avoid impulsive purchases driven solely by social media panic or euphoria, focusing instead on building solid, verified, debt-free wealth.
🧮
Physical Bullion Allocation Calculator
Select or enter an investment budget to see estimated fine ounces and grams at live retail premiums:
🟡 Fine Gold (~3.5% avg retail premium)~25.24 g (0.81 oz troy)
⚪ Fine Silver (VAT + premium included)~1586.5 g (51.0 oz troy)
* Estimación orientativa basada en spot en vivo (114.86 €/g oro | 1.55 €/g plata) y primas ponderadas de distribuidores líderes.
Frequently Asked Questions on Silver Drops and Physical Investing
Is it safe to buy silver when international market prices fall?
Yes, it is actually the preferred time for many experienced investors, provided you account for temporary retail premium spikes due to surging demand.
Why doesn't the chart price match what I pay at the shop?
Chart spot prices reflect wholesale paper markets (futures). Shop prices include fabrication, distribution, applicable taxes, and dealer markups.
Which format is best to start accumulating physical silver?
Government mint 1-ounce bullion coins are the most recommended option due to high global liquidity and easy resale compared to large bars.
Utilizamos cookies propias y de terceros para asegurar el correcto funcionamiento de TroyRadar y guardar
tus preferencias de tema visual. Al continuar navegando, aceptas su uso legal.
⚡
Nuevos precios disponiblesHay cotizaciones actualizadas en el comparador.