How Big Tech's $96.6B AI Spending Delays Fed Cuts and Weighs on Gold
✍️ Analista TroyRadar📅 30 de octubre de 2026⏱️ 5 min read👁️ 40 lecturas
📑Table of Contents
El gasto de capital sin precedentes de las grandes empresas tecnológicas para construir infraestructura de inteligencia artificial está alterando la lectura macroeconómica de la Reserva Federal. Un desembolso trimestral de 96.600 millones de dólares entre Alphabet y Microsoft ha contribuido a sostener un PIB estadounidense del 3,4% y un PCE subyacente del 3,1%, posponiendo la flexibilización monetaria e imponiendo una presión directa sobre las cotizaciones de los metales preciosos.
🟡 Spot Oro de Referencia113.09 €/g
⚪ Spot Plata de Referencia1.42 €/g
⚖️ Ratio Oro / Plata (GSR)79.64 (Ventana Histórica de Valor)
Puntos Clave del Análisis
Capex distorsionador: La inversión masiva en servidores y centros de datos eleva artificialmente las cifras de crecimiento de EE. UU., manteniendo a la Fed en un sesgo restrictivo a pesar de la división interna en la votación (10 a 2).
Coste de oportunidad: Dado que el oro no ofrece rendimiento nominal, un entorno de tipos oficiales sostenidos incrementa el coste de mantener metal físico frente a renta fija de corto plazo.
Fricción comercial en el mercado español: A las cotizaciones actuales de 113,09 €/g en oro y 1,42 €/g en plata, el inversor físico en España debe calcular márgenes comerciales y el 21% de IVA en la plata antes de esperar rentabilidades netas.
«Alphabet vio duplicarse su división cloud, pero su flujo de caja libre pasó a terreno negativo. El mercado financiero está financiando el despliegue de la IA, y los tipos de interés elevados resultantes los paga el oro en el corto plazo.»
— Megan King Diaz / GoldSilver Report
La paradoja del capex tecnológico y los tipos de la Fed
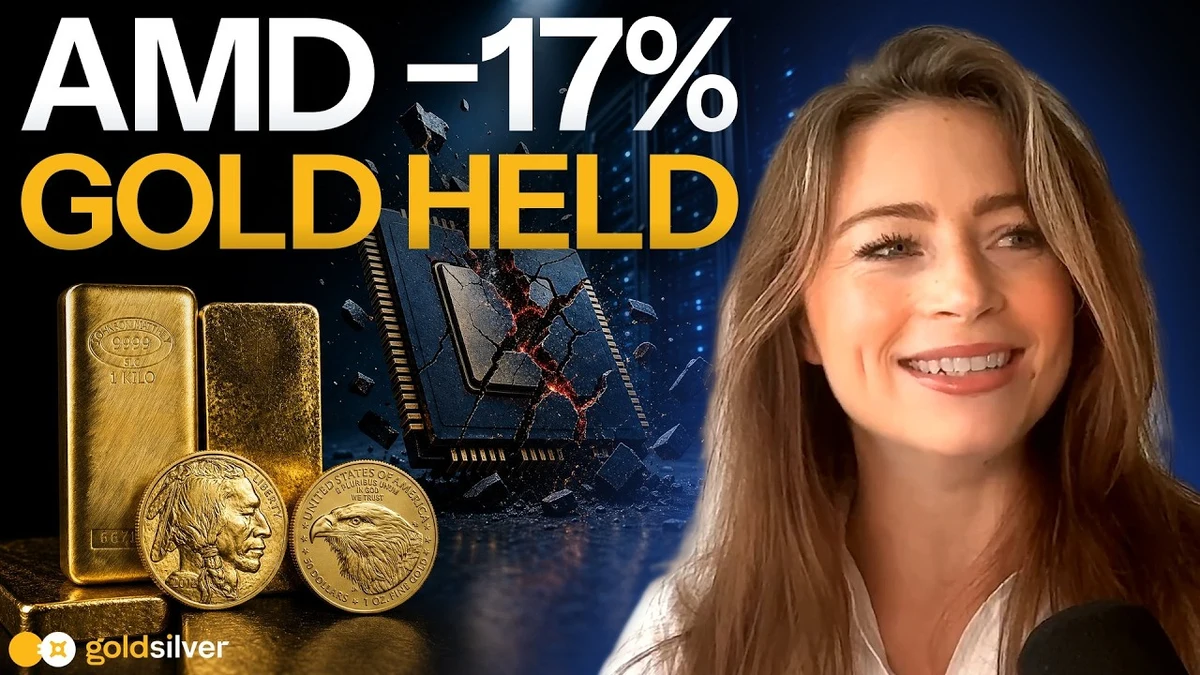
En el último informe analizado por GoldSilver, Megan King Diaz subraya una dinámica inusual: el gasto de capital empresarial (capex) está actuando como motor aislado de la actividad económica estadounidense. Las partidas dirigidas a semiconductores, energía y centros de datos han compensado la ralentización del consumo minorista, sosteniendo un PIB trimestral del 3,4% y situando el deflactor del gasto en consumo personal (PCE subyacente) en el 3,1% interanual.
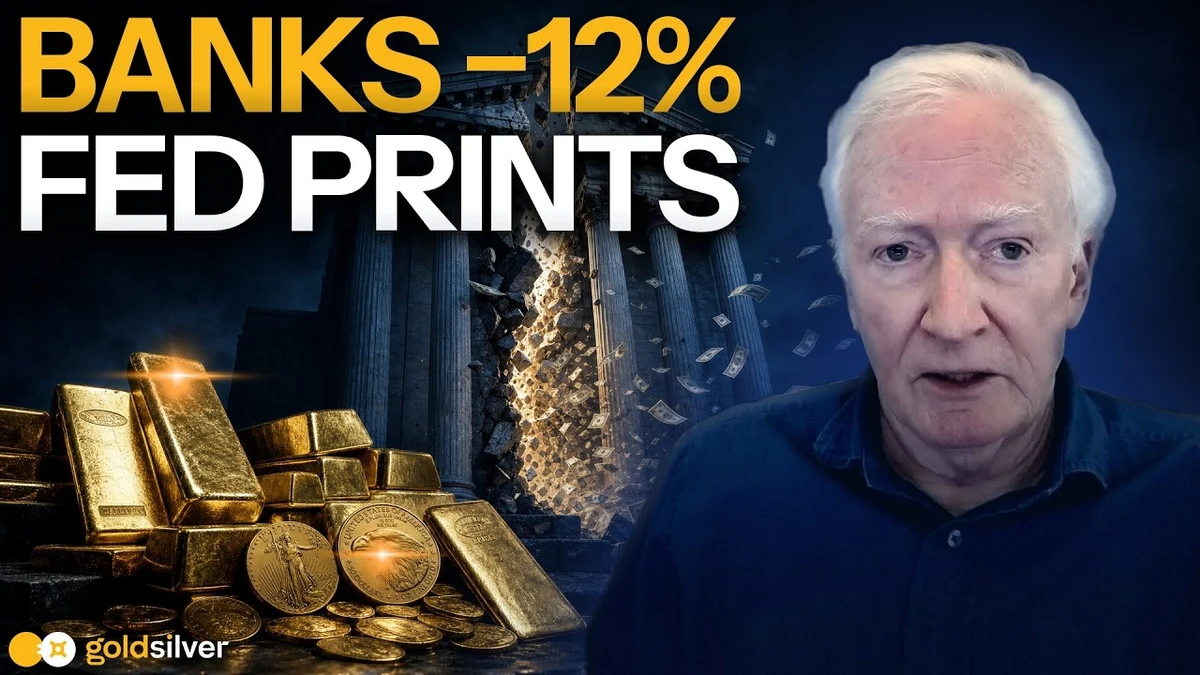
Esta firmeza en los datos宏económicos dificulta el sesgo acomodaticio de la Reserva Federal. Aunque la votación del comité reflejó una división interna de 10 a 2 respecto a la trayectoria de las tasas, el mensaje dominante para los mercados monetarios es claro: los tipos se mantendrán en niveles restrictivos más tiempo de lo anticipado. Para el metal precioso, esto implica un endurecimiento en la competencia por el capital líquido.
💡
Calculadora de Primas y Sobreprecios TroyRadar
Compara el precio spot del oro con las primas reales cobradas por los distribuidores en España y Europa antes de realizar tu compra.
Rendimiento real frente a tenencia física: el cálculo del inversor
Uno de los argumentos centrales expuestos por el informe de GoldSilver es la máxima del mercado de renta fija: «el oro no paga ningún rendimiento». Cuando los tipos de interés reales disminuyen levemente pero las tasas nominales siguen en cotas altas, los activos sin cupón sufren en las carteras tácticas de corto plazo. Sin embargo, la tesis de inversión a largo plazo en metales nobles no se fundamenta en los movimientos semanales del PIB, sino en la acumulación sistémica de deuda pública y el deterioro de los flujos de caja corporativos.
El caso de Alphabet es ilustrativo: a pesar de doblar el volumen de su negocio en la nube, el desembolso en IA convirtió su flujo de caja libre en negativo durante el trimestre. Parte de este despliegue se está financiando mediante deuda corporativa de cupón elevado, lo que añade presión sobre el sistema crediticio general.
Análisis cuantitativo de compra física en el mercado español
Para trasladar estas métricas macroeconómicas a la operativa de un inversor en España, es indispensable analizar las condiciones del mercado físico actual con los datos en directo de TroyRadar:
Oro Spot: 113,09 €/g (aprox. 3.517,50 €/oz troy). Una moneda bullion de 1 oz (como Filarmónica o Krugerrand) suele comercializarse en España con una prima de entre el 3,5% y el 5% sobre spot, situando el coste final de adquisición en torno a los 3.640 - 3.690 €. Dado que el spread de recompra suele situarse entre el 1,5% y el 2%, la brecha de amortización inicial es de un 5% a 7%.
Plata Spot: 1,42 €/g (aprox. 44,16 €/oz troy). En España y la Unión Europea, la plata física no destinada a uso industrial tributa como lingote o moneda al tipo general de IVA del 21% (salvo régimen especial de bienes usados o importación bajo margen). Tras añadir un margen de distribución comercial del 10%-12%, la prima efectiva total escala fácilmente al 30-35%.
Este desglose demuestra por qué la plata requiere un horizonte temporal marcadamente más amplio que el oro para superar los costes de fricción fiscal y comercial, a pesar de que su demanda industrial —especialmente en el sector fotovoltaico— siga registrando máximos históricos.
📈
Monitor de Cotizaciones en Tiempo Real
Consulta el precio spot actualizado al segundo en euros por gramo para oro y plata, junto al Ratio Oro/Plata (GSR).
Simulador de Compra Física: ¿Cuánto metal adquieres hoy?
Selecciona o introduce un presupuesto en euros para calcular el metal fino estimado a precios de mercado actuales:
🟡 Oro Físico (prima media ~3,5%)~25.63 g (0.82 oz troy)
⚪ Plata Física (prima + IVA incluido ~22%)~1731.7 g (55.7 oz troy)
* Estimación orientativa basada en spot en vivo (113.09 €/g oro | 1.42 €/g plata) y primas ponderadas de distribuidores líderes.
Preguntas Frecuentes
¿Por qué cae el oro si el gasto masivo en IA demuestra incertidumbre?
El gasto masivo eleva las cifras agregadas de PIB y actividad económica a corto plazo. Esto lleva a la Reserva Federal a posponer la bajada de tipos de interés, elevando la rentabilidad de los bonos del Tesoro y aumentando el coste de oportunidad de mantener oro sin rendimiento nominal.
¿Cómo afecta el IVA español a la compra de plata frente al oro?
El oro de inversión está exento de IVA en España y en toda la UE según la Directiva 2006/112/CE. En cambio, la plata física soporta un 21% de IVA general, lo que exige un diferencial de revalorización mucho mayor para alcanzar el umbral de rentabilidad.
¿Qué significa el Ratio Oro/Plata actual de 79,64?
Un Ratio Oro/Plata (GSR) de 79,64 indica que se necesitan casi 80 onzas de plata para comprar una onza de oro. Históricamente, niveles cercanos o superiores a 80 señalan una infravaloración relativa de la plata respecto al oro, aunque ajustada por el impacto fiscal y la volatilidad comercial de esta última.
Unprecedented corporate capital expenditures by Big Tech to build artificial intelligence infrastructure are skewing the Federal Reserve's macroeconomic dataset. A single quarterly spend of $96.6 billion by Alphabet and Microsoft helped support US GDP at 3.4% and core PCE at 3.1%, pushing back monetary easing and placing direct headwinds on precious metals spot prices.
🟡 Gold Spot Benchmark113.09 €/g
⚪ Silver Spot Benchmark1.42 €/g
⚖️ Gold / Silver Ratio (GSR)79.64 (Historical Value Window)
Key Analytical Takeaways
Distorting Capex: Massive infrastructure deployment in servers and data centers artificially inflates headline US growth, reinforcing a higher-for-longer Fed stance despite a 10-to-2 split vote.
Opportunity Cost Pressure: Because gold yields no nominal coupon, sustained elevated policy rates increase the holding cost of physical metal compared to short-term money market instruments.
European Retail Friction: With live spot prices at €113.09/g for gold and €1.42/g for silver, physical investors in European jurisdictions must account for dealer premiums and standard VAT hurdles before reaching breakeven.
“Alphabet's cloud revenue doubled, but its free cash flow turned negative. Wall Street is funding the AI build-out, and gold is paying the price for the resulting elevated interest rate environment in the short term.”
— Megan King Diaz / GoldSilver Report
The Tech Capex Paradox and Federal Reserve Policy
In the recent analysis presented by GoldSilver, Megan King Diaz highlights an unusual structural driver: corporate capital expenditure is acting as an isolated engine for overall US economic figures. Spending targeted at semiconductors, power infrastructure, and hyperscale data centers offset weakness in consumer discretionary indicators, sustaining quarterly GDP at 3.4% and core PCE inflation at 3.1% year-over-year.
This macro resilience complicates any dovish shift by the Federal Reserve. Although the FOMC vote revealed an internal 10-to-2 division, the broader message for fixed-income markets remains firm: benchmark rates will stay restrictive longer than expected. For non-yielding precious metals, this translates into persistent competition for capital allocation.
💡
TroyRadar Premium & Spread Calculator
Compare spot metal prices directly against real dealer premiums across European markets before making buying decisions.
Real Yields vs. Physical Holding: The Investor's Math
A core thesis of the GoldSilver report centers on the bond market maxim: "Gold pays you nothing in nominal yield." When real yields dip slightly but nominal rates stay elevated, zero-yield assets experience short-term tactical selling. However, the long-term investment case for bullion relies not on weekly GDP prints, but on structural fiscal deficits, sovereign debt expansion, and deteriorating corporate cash flows.
Alphabet provides a clear case study: despite doubling cloud division revenues, heavy AI expenditures pushed quarterly free cash flow into negative territory. Much of this corporate build-out relies on debt markets, keeping underlying credit conditions tight.
Quantitative Analysis for European Bullion Buyers
Translating these macroeconomic forces into actionable data for European investors requires examining real spot pricing provided by TroyRadar:
Spot Gold: €113.09/g (approx. €3,517.50/oz troy). A 1 oz bullion coin (such as a Philharmonic or Krugerrand) typically carries a retail markup of 3.5% to 5% above spot in Europe, bringing total cost to ~€3,640–€3,690. With buyback spreads ranging around 1.5% to 2%, initial break-even friction sits at 5% to 7%.
Spot Silver: €1.42/g (approx. €44.16/oz troy). In Spain and several EU countries, non-exempt silver bullion carries a standard 21% VAT (unless traded under margin schemes). Combined with retail mint margins of 10%–12%, effective total premiums can reach 30%–35%.
This quantitative reality highlights why physical silver requires a significantly longer investment horizon to absorb transactional friction, despite booming industrial consumption in solar photovoltaics.
📈
Real-Time Live Metals Monitor
Track updated gold and silver spot rates in euros per gram alongside the Gold/Silver Ratio (GSR) in real time.
Select or enter an investment budget to see estimated fine ounces and grams at live retail premiums:
🟡 Fine Gold (~3.5% avg retail premium)~25.63 g (0.82 oz troy)
⚪ Fine Silver (VAT + premium included)~1731.7 g (55.7 oz troy)
* Estimación orientativa basada en spot en vivo (113.09 €/g oro | 1.42 €/g plata) y primas ponderadas de distribuidores líderes.
Frequently Asked Questions
Why does gold drop if massive AI spending signals market uncertainty?
Large Capex temporarily boosts overall GDP and economic activity metrics. This allows the Fed to delay rate cuts, keeping treasury yields attractive and increasing the opportunity cost of holding non-yielding gold.
How does European taxation affect silver purchases compared to gold?
Investment gold is VAT-exempt across the EU under Directive 2006/112/EC. Physical silver bullion generally incurs standard VAT rates (such as 21% in Spain), requiring greater spot price appreciation to net positive gains.
What does the current Gold/Silver Ratio of 79.64 signify?
A GSR of 79.64 means it takes roughly 80 ounces of silver to purchase one ounce of gold. Historically, ratios around 80 reflect relative undervaluation of silver versus gold, though investors must factor in higher retail transaction costs for silver.
📚 Artículos Relacionados en Macroeconomía y Bancos Centrales
Utilizamos cookies propias y de terceros para asegurar el correcto funcionamiento de TroyRadar y guardar
tus preferencias de tema visual. Al continuar navegando, aceptas su uso legal.
⚡
Nuevos precios disponiblesHay cotizaciones actualizadas en el comparador.