Tech Rout & US Elections: Gold Holds Firm as Physical Silver Diverges
✍️ Analista TroyRadar📅 6 de noviembre de 2026⏱️ 11 min read👁️ 79 lecturas
📑Table of Contents
🟡 Spot Oro de Referencia117.22 €/g
⚪ Spot Plata de Referencia1.5 €/g
⚖️ Ratio Oro / Plata (GSR)78.15 (Ventana Histórica de Valor)
Tras el desenlace electoral en Estados Unidos y la corrección masiva en las cotizaciones tecnológicas —con desplomes diarios del 17% en gigantes como AMD y pérdidas acumuladas de 2,5 billones de dólares en el sector de los semiconductores—, los mercados financieros han experimentado una brusca reordenación de flujos. Mientras la renta variable sufría una severa toma de beneficios, la cotización del oro físico mantuvo su soporte operativo, consolidando su papel como activo monetario de reserva frente a la volatilidad industrial que penalizó a la plata.
Conclusiones Operativas Clave
Divergencia entre metales: El oro resistió el choque bursátil debido a su carácter puramente monetario, mientras que la plata acusó la corrección tecnológica por su peso en el sector industrial y centros de datos.
Tipos reales a la baja: El rendimiento real ajustado slipping al 2,65% afianzó el coste de oportunidad del oro frente a la deuda soberana.
Primas en el mercado físico: En España, las monedas de oro de 1 oz cotizan con primas contenidas entre el +0,47% y el +0,51%, en marcado contraste con los lingotes de plata que soportan recargos de entre el +24,85% y el +28,41%.
Garantía de liquidez: La evaluación del diferencial entre precio de compra y recompra sigue siendo indispensable para evitar pérdidas de capital al rotar posiciones físicas.
El Impacto Político en Washington: Gasto Público, Aranceles y Rendimientos Reales
El escenario institucional resultante de los últimos comicios estadounidenses plantea una reconfiguración directa en las expectativas fiscal y monetaria de la primera economía global. Cuando los mercados absorben giros de poder en el Congreso y el Senado, el primer vector de ajuste se traslada a la emisión de deuda soberana y al coste financiero del Tesoro. El aumento del gasto público comprometido, sumado a la incertidumbre sobre la política arancelaria global, tiende a mantener la presión estructural sobre el déficit federal, un factor que los analistas macroeconómicos vigilan de cerca por su efecto directo en la devaluación del poder adquisitivo divisa.
Uno de los datos más determinantes para la valoración de los metales preciosos durante este periodo ha sido el comportamiento del rendimiento real de los bonos del Tesoro estadounidense a diez años, situándose en el 2,65%. La rentabilidad real —entendida como el tipo nominal menos las expectativas de inflación a largo plazo— mide directamente el coste de oportunidad de mantener metales físicos en cartera, dado que ni el oro ni la plata devengan cupones ni dividendos. Cuando los tipos reales ceden, el atractivo de conservar activos tangibles sin riesgo de contrapartida aumenta de forma proporcional.
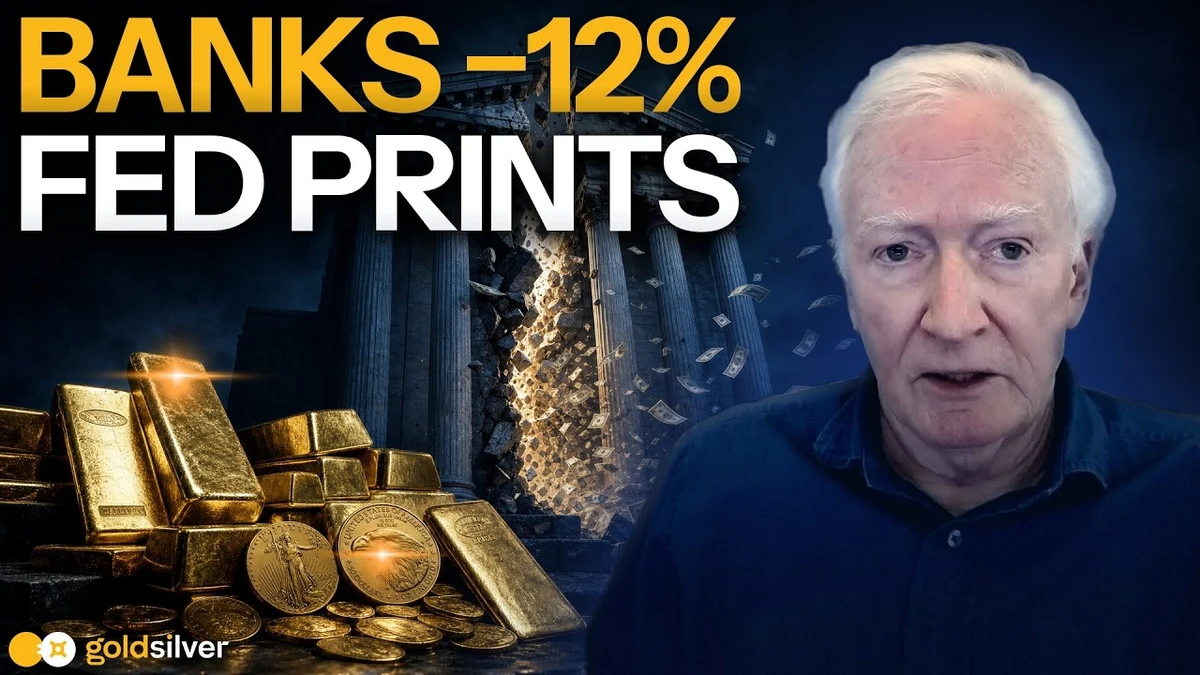
De forma paralela, el mercado energético ha experimentado fuertes oscillaciones, con el barril de crudo Brent corrigiendo drásticamente tras cotizar por encima de los 106 dólares para luego ceder más de 20 dólares en cuestión de días. Esta contracción del coste de la energía alivia temporalmente la presión inflacionaria por el lado de la oferta, pero a su vez refleja las dudas del mercado respecto al ritmo de crecimiento económico global. Para una revisión detallada sobre cómo la emisión dineraria de los bancos centrales impacta en las reservas físicas durante periodos de inestabilidad, resulta oportuno consultar nuestro estudio sobre crisis bancaria, impresión de dinero de la Fed y su impacto en el oro físico.
⚡ Oportunidades Destacadas del Mercado (Menor Prima % en Tiendas)
Producto
Tienda
Precio
Prima %
Fecha Registro
1 oz Moneda de Oro | dañado
StoneX Bullion
3671.71 €
+0.47%
📅 5 de noviembre de 2026
Medalla de Oro Visita Juan Carlos I a México – 1 oz – México – 1978 – Recomprada
La Dobla Bullion
3490.99 €
+0.51%
📅 3 de noviembre de 2026
100 Coronas Francisco José I Austria | Oro
StoneX Bullion
3599.3 €
+0.52%
📅 5 de noviembre de 2026
Moneda de Plata 5 Pesetas Circulada
Dracma Metales
34.35 €
+7.79%
📅 2 de noviembre de 2026
Moneda de PLATA Canguro 1 oz Australia. 2026.
CMC Metales
50.14 €
+9.67%
📅 30 de octubre de 2026
Moneda de Plata de 5 Pesetas Circulada – España – 1868 – 1898
El Descalabro Tecnológico y la Inteligencia Artificial: La Divergencia entre Oro y Plata
La jornada posterior a las votaciones dejó una de las correcciones más pronunciadas del ejercicio en el índice Nasdaq, focalizada en la industria de hardware para Inteligencia Artificial y microprocesadores. Empresas de referencia como Advanced Micro Devices (AMD) sufrieron desplomes del 17% en una sola sesión, arrastrando al conjunto del sector hasta evaporar cerca de 2,5 billones de dólares de capitalización bursátil global. Esta severa corrección puso a prueba las elevadas valoraciones que Wall Street había descontado respecto a la demanda ilimitada de centros de datos y componentes electrónicos.
En este contexto de volatilidad bursátil, el comportamiento de los metales preciosos mostró una marcada divergencia funcional. El oro actuó como activo refugio puro, absorbiendo flujos de liquidez procedentes de la renta variable tecnológica y manteniendo su nivel de cotización sin ceder terreno significativo. Por el contrario, la plata acusó un comportamiento sensiblemente más débil. La explicación técnica de este desacoplamiento reside en la naturaleza dual de la plata: más del 50% de la demanda global de plata física procede de aplicaciones industriales, donde la fabricación de semiconductores, componentes fotovoltaicos y servidores para IA desempeñan un papel protagonista.
Al temblar las perspectivas del sector tecnológico, la cotización spot de la plata sufrió ventas por parte de inversores institucionales que anticipaban un menor consumo industrial a corto plazo. Este fenómeno expandió el ratio oro/plata (Gold/Silver Ratio - GSR) hasta situarse en 78,15 puntos. Un GSR en niveles de 78 indica que se necesitan 78,15 onzas de plata para adquirir una sola onza de oro. Para contextualizar este indicador en el marco de las volatilidades recientes, puede revisarse el análisis técnico semanal del oro y la plata con el ratio en 77,73.
«Mientras el sector tecnológico borraba 2,5 billones de dólares en capitalización bursátil tras el recuento electoral, el oro demostró por qué es un activo monetario de reserva: se mantuvo firme mientras los activos industriales y la plata sufrían la toma de beneficios.»
— Análisis de Mercado de GoldSilver (Megan King Diaz)
Radiografía del Mercado Físico en España: Primas, Cotizaciones y Tiendas Auditadas
Para el inversor residente en España o en la Eurozona, las cotizaciones bursátiles en dólares deben pasarse por el filtro de la divisa comunitaria y de las condiciones reales de suministro en distribuidores autorizados. En la jornada actual, la cotización spot del oro y la plata en tiempo real registra unos niveles base de 117,22 € por gramo de oro (aproximadamente 3.646 € por onza troy) y 1,50 € por gramo de plata (46,65 € la onza troy).
Sin embargo, adquirir lingotes o monedas en el mercado minorista implica abonar una prima comercial sobre el valor intrínseco del metal spot. Estas primas cubren los costes de acuñación, transporte, seguro, refinado y el margen operativo del distribuidor. A través del análisis de datos de TroyRadar sobre establecimientos auditados en España y Europa, se observan diferencias estructurales de peso entre el mercado del oro y el de la plata.
Como demuestra el desglose numérico, la liquidez y competitividad de las monedas de oro de 1 onza e instrumentos monetarios históricos permiten acceder al metal dorado con recargos inferiores al 0,60% en distribuidores líderes. En el caso de los lingotes de oro de 100 gramos o formatos superiores de 1 kg, las primas oscilan entre el +0,76% y el +0,92%. Esta reducida horquilla responde a la exención fiscal del oro de inversión y a la madurez de las cadenas de distribución europeas.
Situación radicalmente opuesta presenta la plata física. La adquisición de lingotes de plata de 1 kg comporta primas superiores al +24%, alcanzando el +28,41% en formatos de fundición estándar. Esta penalización económica se debe principalmente al tratamiento del Impuesto sobre el Valor Añadido (IVA) en la Unión Europea, donde la plata no goza del estatus de bien de inversión monetario, gravándose al tipo general del 21% salvo estructuraciones bajo régimen especial de bienes usados (REBU). Para profundizar en el impacto del desabastecimiento físico sobre estos sobreprecios, se sugiere consultar la lectura sobre el déficit en plata física y presión de mercado.
💡
Calculadora de Primas y Sobreprecios TroyRadar
Calcula al instante el porcentaje exacto de prima que estás pagando sobre la cotización spot en cualquier moneda o lingote antes de comprar.
Dinámica de Precios, Riesgos de Volatilidad y Gestión de Spreads
Es vital recalcar que la inversión en metales preciosos no está exenta de riesgos financieros significativos. Aunque la narrativa de mercado sitúe al oro como un refugio de valor histórico frente a la devaluación fiduciaria, los precios spot experimentan fases de severa corrección. Factores como un endurecimiento repentino de los tipos de interés por parte de la Reserva Federal o el Banco Central Europeo, una apreciación del dólar o la liquidación masiva de contratos de futuro por parte de fondos cotizados (ETFs) pueden generar caídas acusadas en los precios nominados en euros.
Además de la volatilidad del precio spot, el comprador físico se enfrenta al diferencial de compra-venta o spread de recompra. Cuando se adquiere una moneda de plata de 1 onza a un precio final que incluye un +9,67% de prima, esa pieza debe revalorizarse al menos ese mismo porcentaje en el mercado spot para que el inversor pueda liquidarla en una tienda sin incurrir en una pérdida neta de capital. En productos con primas elevadas, como la granalla de plata o los lingotes de 1 kg (con primas del +24% al +28%), la barrera de revalorización requerida para alcanzar el punto de equilibrio es notablemente alta.
A este factor se añaden los costes indirectos asociados al almacenamiento seguro, la contratación de cajas de seguridad privadas o pólizas de seguro de hogar con cobertura explícita para metales nobles. Quienes estén analizando la adquisición de moneda histórica española pueden examinar nuestro análisis sobre análisis de punzones en oro y subastas de plata en España para comprender los criterios de autenticación y preservación que exige el mercado secundario.
Fiscalidad Española y Estrategia Patrimonial: IRPF, IVA y REBU
La planificación de compras en España exige dominar el marco normativo tributario para evitar contingencias fiscales inesperadas con la Agencia Tributaria. El oro físico de inversión disfruta de una exención especial del IVA en virtud de la Ley 37/1992 del Impuesto sobre el Valor Añadido, siempre que cumpla con los requisitos formales: lingotes con una pureza igual o superior al 99,5% y monedas con una pureza no inferior al 90%, acuñadas con posterioridad al año 1800 y cuyo precio de venta no supere en más de un 80% el valor de mercado del oro contenido.
Por el contrario, las compras de plata física nueva están sujetas al tipo general del 21% de IVA en la Península y Baleares. Ciertos distribuidores operan bajo el Régimen Especial de Bienes Usados (REBU) para la venta de monedas y piezas de plata de segunda mano, tributando únicamente por el margen de beneficio de la tienda y no por el valor total de la pieza. Esta diferenciación explica por qué las monedas de 5 pesetas de plata circuladas presentan primas significativamente menores (+7,79%) en comparación con lingotes de fabricación reciente.
En el momento de la desinversión o venta de los metales, la ganancia o pérdida patrimonial debe integrarse en la base imponible del ahorro del IRPF. Los tramos vigentes oscilan entre el 19% para los primeros 6.000 euros de ganancia y llegan hasta el 28% para cuantías elevadas. Guardar las facturas reglamentarias con el desglose de IVA y los certificados de ensayo expedidos por las casas de moneda es un requisito indispensable para acreditar el precio de adquisición real y minorar la carga fiscal resultante. Quienes deseen asesoramiento sobre el canal de compra adecuado en su localidad pueden consultar las guías sobre dónde comprar oro en España.
⚖️
Calculadora Fiscal de IRPF para Metales Preciosos
Determina la tributación exacta por ganancia patrimonial al vender tus monedas o lingotes de oro y plata en España.
Conclusión y Perspectiva de Mercado para el Inversor
El comportamiento divergente entre el oro y la plata tras el vertiginoso ajuste del sector tecnológico reafirma la necesidad de diferenciar los activos por su función macroeconómica. Mientras que el oro consolida su rol como reserva monetaria inmune a la volatilidad de los beneficios corporativos de Silicon Valley, la plata mantiene un perfil híbrido expuesto a las variaciones del ciclo industrial. Antes de realizar cualquier asignación de capital, el inversor debe consultar un comparador de tiendas de oro y plata transparente, supervisar el precio del gramo de oro hoy en España y calcular la prima exacta aplicable a cada formato comercial para garantizar la eficiencia operativa de su patrimonio.
❓ Preguntas Frecuentes
¿Por qué el oro resistió la caída bursátil mientras la plata bajó tras las elecciones?
El oro actúa prioritariamente como un activo monetario de reserva sin riesgo de contrapartida, por lo que absorbe flujos de capital que huyen de la volatilidad bursátil. En cambio, más del 50% de la demanda global de plata es industrial (destinada a electrónica, solar y centros de datos de IA). La fuerte corrección en acciones de semiconductores como AMD generó incertidumbre sobre el consumo industrial de plata a corto plazo, presionando su precio a la baja.
¿Cómo afecta el rendimiento real del bono a diez años al precio del oro?
El rendimiento real de los bonos del Tesoro (tipo nominal menos inflación esperada) mide el coste de oportunidad de conservar metales nobles. Como el oro físico no paga cupones ni dividendos, cuando los rendimientos reales caen (por ejemplo, situándose en el 2,65%), el atractivo de sostener oro frente a la deuda pública aumenta, impulsando la demanda compradora en los mercados financieros.
¿Por qué hay tanta diferencia de primas entre las monedas de oro y los lingotes de plata?
El oro de inversión está exento del pago de IVA en España y la Unión Europea bajo la Ley 37/1992, lo que permite a los distribuidores ofrecer monedas de 1 oz con primas reducidas de entre el +0,47% y el +0,51%. La plata física nueva, por el contrario, está gravada con un 21% de IVA general, lo que eleva el sobreprecio final de los lingotes de 1 kg hasta superar el +24% o +28% sobre la cotización spot.
¿Qué impuesto debo pagar al vender mis monedas de oro en España?
La venta de oro de inversión está exenta de IVA, pero la ganancia o pérdida patrimonial generada (diferencia entre precio de venta y precio de compra acreditado en factura) debe tributar en la base imponible del ahorro del IRPF. Los tipos aplicables oscilan entre el 19% para las ganancias de hasta 6.000 euros y el 28% para tramos superiores.
🧮
Simulador de Compra Física: ¿Cuánto metal adquieres hoy?
Selecciona o introduce un presupuesto en euros para calcular el metal fino estimado a precios de mercado actuales:
🟡 Oro Físico (prima media ~3,5%)~24.73 g (0.8 oz troy)
⚪ Plata Física (prima + IVA incluido ~22%)~1639.3 g (52.7 oz troy)
* Estimación orientativa basada en spot en vivo (117.22 €/g oro | 1.50 €/g plata) y primas ponderadas de distribuidores líderes.
🟡 Gold Spot Benchmark117.22 €/g
⚪ Silver Spot Benchmark1.5 €/g
⚖️ Gold / Silver Ratio (GSR)78.15 (Historical Value Window)
Following the outcome of the US elections and a massive correction in tech equities—featuring 17% single-day drops in giants like AMD and cumulative sector losses reaching $2.5 trillion in semiconductors—financial markets experienced a sharp reallocation of capital flows. As equities endured severe profit-taking, physical gold maintained its operational support, consolidating its role as a reserve monetary asset against the industrial volatility that penalized silver.
Key Operational Takeaways
Divergence between metals: Gold weathered the equity shock due to its purely monetary nature, whereas silver suffered from the tech correction given its structural weight in the industrial sector and data centers.
Declining real yields: The adjusted real yield slipping to 2.65% anchored the opportunity cost of holding gold relative to sovereign debt.
Physical market premiums: In Spain, 1 oz gold coins trade at tight premiums between +0.47% and +0.51%, in stark contrast to silver bars, which carry markups between +24.85% and +28.41%.
Liquidity assurance: Evaluating the spread between buy and buyback prices remains essential to prevent capital loss when rotating physical positions.
Political Impact in Washington: Public Spending, Tariffs, and Real Yields
The post-election institutional landscape in the United States presents a direct reconfiguration of fiscal and monetary expectations for the world's largest economy. When markets absorb shifts in power across Congress and the Senate, the primary vector of adjustment transfers to sovereign debt issuance and Treasury financing costs. Rising public spending commitments, combined with uncertainty surrounding global tariff policy, tend to maintain structural pressure on the federal deficit—a factor closely monitored by macroeconomic analysts due to its direct debasement effect on currency purchasing power.
One of the most decisive metrics for precious metals valuation during this period has been the behavior of the 10-year US Treasury real yield, which settled at 2.65%. Real yield—defined as nominal yield minus long-term inflation expectations—directly measures the opportunity cost of holding physical bullion in a portfolio, as neither gold nor silver yields coupons or dividends. When real yields ease, the rationale for holding non-counterparty physical assets increases proportionally.
In parallel, the energy market experienced sharp gyrations, with Brent crude correcting sharply after trading above $106 to drop over $20 in a matter of days. This contraction in energy costs temporarily relieves supply-side inflationary pressures, yet simultaneously reflects market doubts regarding global economic growth momentum. For a detailed review of how central bank monetary expansion impacts physical reserves during turbulent periods, see our report on banking crisis, Fed money printing, and its impact on physical gold.
⚡ Real-Time Bullion Deals in European Dealers (Lowest Premium %)
Product / Bullion
Dealer / Store
Price
Premium %
Recorded
1 oz Moneda de Oro | dañado
StoneX Bullion
3671.71 €
+0.47%
📅 November 5, 2026
Medalla de Oro Visita Juan Carlos I a México – 1 oz – México – 1978 – Recomprada
La Dobla Bullion
3490.99 €
+0.51%
📅 November 3, 2026
100 Coronas Francisco José I Austria | Oro
StoneX Bullion
3599.3 €
+0.52%
📅 November 5, 2026
Moneda de Plata 5 Pesetas Circulada
Dracma Metales
34.35 €
+7.79%
📅 November 2, 2026
Moneda de PLATA Canguro 1 oz Australia. 2026.
CMC Metales
50.14 €
+9.67%
📅 October 30, 2026
Moneda de Plata de 5 Pesetas Circulada – España – 1868 – 1898
The Tech Rout and AI: The Divergence Between Gold and Silver
The session following the elections registered one of the sharpest corrections of the year for the Nasdaq index, concentrated in AI hardware and microprocessors. Industry benchmarks such as Advanced Micro Devices (AMD) plummeted 17% in a single trading day, dragging down the broader sector and erasing nearly $2.5 trillion in global market capitalization. This severe pullback put Wall Street's elevated valuations to the test regarding unlimited demand expectations for data centers and electronic components.
Amid this equity volatility, precious metals exhibited a clear functional divergence. Gold functioned as a pure safe-haven asset, absorbing liquidity flows exiting tech equities and holding its price level without surrendering meaningful ground. Conversely, silver displayed notably weaker price action. The technical explanation for this decoupling lies in silver's dual nature: over 50% of global physical silver demand originates from industrial applications, where semiconductor fabrication, photovoltaic components, and AI servers play a central role.
As technology growth expectations faltered, spot silver faced selling pressure from institutional investors anticipating lower near-term industrial consumption. This expanded the Gold/Silver Ratio (GSR) to 78.15 points. A GSR at 78 indicates that 78.15 ounces of silver are required to purchase a single ounce of gold. To contextualize this indicator within recent volatility, refer to our weekly technical analysis of gold and silver with the GSR ratio at 77.73.
«While the tech sector wiped out $2.5 trillion in market capitalization following the election tally, gold proved why it serves as a reserve monetary asset: it held firm while industrial assets and silver faced profit-taking.»
— GoldSilver Market Analysis (Megan King Diaz)
Snapshot of the Physical Market in Spain: Premiums, Spot Rates, and Audited Dealers
For investors residing in Spain or the Eurozone, dollar-denominated spot prices must be filtered through the single currency and real supply conditions at authorized dealers. Today, real-time spot gold and silver prices show baseline levels of €117.22 per gram of gold (approximately €3,646 per troy ounce) and €1.50 per gram of silver (€46.65 per troy ounce).
However, purchasing coins or bars in the retail market requires paying a commercial premium over spot intrinsic value. These premiums cover minting, logistics, insurance, refining, and dealer operational margins. Analyzing TroyRadar data across audited establishments in Spain and Europe reveals significant structural disparities between the gold and silver markets.
As the data illustrates, the liquidity and competitiveness of 1 oz gold coins and historic monetary formats enable investors to acquire gold at premiums below 0.60% at leading dealers. For 100-gram gold bars or larger 1 kg formats, premiums range between +0.76% and +0.92%. This narrow spread reflects gold's investment-grade tax-exempt status and mature European distribution chains.
Physical silver presents a radically different picture. Buying 1 kg silver bars involves markups exceeding +24%, reaching +28.41% on standard cast bars. This cost penalty stems primarily from Value Added Tax (VAT) treatment across the European Union, where silver does not carry investment-grade monetary status and is taxed at the standard 21% rate unless structured under secondary margin schemes (REBU). To analyze the impact of physical supply deficits on these markups, read our study on physical silver deficit and market pressure.
💡
TroyRadar Premium & Markup Calculator
Calculate the exact percentage premium over spot you pay on any coin or bar prior to purchasing.
Price Dynamics, Volatility Risks, and Spread Management
Precious metals investment carries notable financial risk. Although market narrative positions gold as a long-term store of value against fiat debasement, spot prices undergo periods of steep correction. Factors such as abrupt rate hikes by the Federal Reserve or ECB, US dollar strength, or heavy ETF futures liquidations can generate sharp drawdowns in euro-denominated prices.
Beyond spot volatility, physical buyers face bid-ask spreads. When acquiring a 1 oz silver coin at a final price containing a +9.67% premium, spot prices must appreciate by at least that percentage before an investor can liquidate without incurring a net capital loss. For high-premium items like silver grain or 1 kg bars (carrying +24% to +28% markups), the breakeven barrier is substantial.
Indirect holding costs must also be considered, including secure vaulting, private safety deposit box rentals, or specialized insurance coverage. Investors exploring historic Spanish coinage should review our piece on analysis of gold hallmarks and silver auctions in Spain for secondary market authentication standards.
Spanish Taxation & Wealth Strategy: IRPF, VAT, and REBU
Tax planning in Spain requires navigating local rules to avoid unexpected liabilities with the tax authority (Agencia Tributaria). Investment gold enjoys a special VAT exemption under Law 37/1992, provided it meets statutory criteria: bars with purity of 99.5% or higher, and coins of at least 90% purity minted after 1800 whose sale price does not exceed the spot gold content value by more than 80%.
Conversely, new physical silver purchases attract standard 21% VAT in mainland Spain and the Balearic Islands. Select dealers utilize the Special Scheme for Second-Hand Goods (REBU) on pre-owned silver coins, levying tax solely on the dealer's margin rather than total piece value. This explains why circulated 5-peseta silver coins carry significantly lower premiums (+7.79%) relative to newly minted bullion bars.
Upon liquidation, capital gains or losses must be declared within the Personal Income Tax (IRPF) savings tax base. Tax brackets range from 19% on the first €6,000 of gain up to 28% for top brackets. Retaining itemized invoices detailing VAT and assay certificates is essential to substantiate acquisition costs. Investors seeking local purchasing channels can review our guides on where to buy gold in Spain.
⚖️
Personal Income Tax (IRPF) Calculator for Precious Metals
Determine exact capital gains tax liabilities when liquidating gold and silver coins or bars in Spain.
The divergent price action between gold and silver following the tech sector adjustment underscores the necessity of categorizing assets by macroeconomic function. While gold reinforces its role as a monetary reserve insulated from Silicon Valley earnings volatility, silver retains a hybrid profile tied to industrial cycles. Prior to allocating capital, investors should utilize a transparent gold and silver dealer comparison tool, monitor the gold price per gram today in Spain, and calculate precise format premiums to ensure capital efficiency.
❓ Frequently Asked Questions
Why did gold hold up during the stock market drop while silver fell after the elections?
Gold functions primarily as a non-counterparty reserve monetary asset, absorbing capital seeking shelter from equity volatility. Conversely, over 50% of global silver demand is industrial (electronics, solar, and AI server infrastructure). The sharp drawdown in semiconductor stocks like AMD generated near-term industrial demand uncertainty, weighing on silver prices.
How do 10-year Treasury real yields affect gold prices?
Treasury real yields (nominal yield minus expected inflation) measure the opportunity cost of holding physical bullion. Because physical gold pays no coupon or dividend, declining real yields (such as 2.65%) enhance the relative appeal of gold over government debt, supporting buying interest.
Why is there such a large premium gap between gold coins and silver bars?
Investment gold is VAT-exempt across Spain and the EU under Law 37/1992, enabling dealers to offer 1 oz coins at low premiums between +0.47% and +0.51%. New physical silver is taxed at the standard 21% VAT rate, pushing final premiums on 1 kg silver bars above +24% to +28% over spot.
What tax applies when selling gold coins in Spain?
Sales of investment gold are exempt from VAT, but realized capital gains (sale price minus invoice-documented purchase price) are taxed within the IRPF savings base. Rates range from 19% on gains up to €6,000 up to 28% for higher amounts.
🧮
Physical Bullion Allocation Calculator
Select or enter an investment budget to see estimated fine ounces and grams at live retail premiums:
🟡 Fine Gold (~3.5% avg retail premium)~24.73 g (0.8 oz troy)
⚪ Fine Silver (VAT + premium included)~1639.3 g (52.7 oz troy)
* Estimación orientativa basada en spot en vivo (117.22 €/g oro | 1.50 €/g plata) y primas ponderadas de distribuidores líderes.
📚 Artículos Relacionados en Macroeconomía y Bancos Centrales
Utilizamos cookies propias y de terceros para asegurar el correcto funcionamiento de TroyRadar y guardar
tus preferencias de tema visual. Al continuar navegando, aceptas su uso legal.
⚡
Nuevos precios disponiblesHay cotizaciones actualizadas en el comparador.